|
Download Data (XLS File) |
|
||||||||
|
||||||||
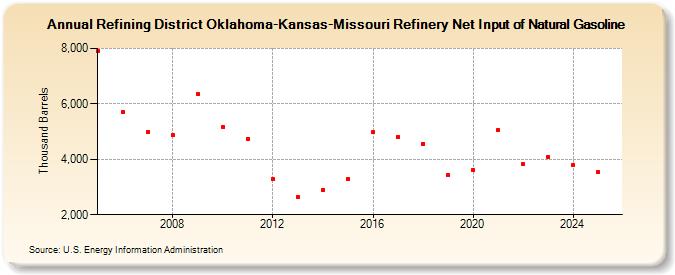
| Refining District Oklahoma-Kansas-Missouri Refinery Net Input of Natural Gasoline (Thousand Barrels) | ||||||||
| Decade | Year-0 | Year-1 | Year-2 | Year-3 | Year-4 | Year-5 | Year-6 | Year-7 | Year-8 | Year-9 |
|---|---|---|---|---|---|---|---|---|---|---|
| 2000's | 7,904 | 5,698 | 4,985 | 4,865 | 6,357 | |||||
| 2010's | 5,170 | 4,748 | 3,288 | 2,642 | 2,906 | 3,301 | 4,968 | 4,813 | 4,569 | 3,428 |
| 2020's | 3,624 | 5,050 | 3,815 | 4,100 |
| - = No Data Reported; -- = Not Applicable; NA = Not Available; W = Withheld to avoid disclosure of individual company data. |
| Release Date: 6/28/2024 |
| Next Release Date: 8/30/2024 |