|
Download Data (XLS File) |
|
||||||||
|
||||||||
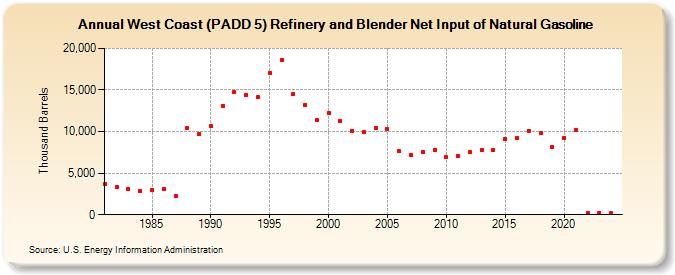
| West Coast (PADD 5) Refinery and Blender Net Input of Natural Gasoline (Thousand Barrels) | ||||||||
| Decade | Year-0 | Year-1 | Year-2 | Year-3 | Year-4 | Year-5 | Year-6 | Year-7 | Year-8 | Year-9 |
|---|---|---|---|---|---|---|---|---|---|---|
| 1980's | 3,654 | 3,311 | 3,128 | 2,866 | 2,942 | 3,052 | 2,269 | 10,441 | 9,714 | |
| 1990's | 10,679 | 13,124 | 14,734 | 14,448 | 14,151 | 17,057 | 18,629 | 14,516 | 13,247 | 11,337 |
| 2000's | 12,250 | 11,266 | 10,110 | 9,899 | 10,471 | 10,326 | 7,628 | 7,168 | 7,544 | 7,828 |
| 2010's | 6,891 | 7,113 | 7,565 | 7,787 | 7,731 | 9,093 | 9,201 | 10,117 | 9,776 | 8,133 |
| 2020's | 9,267 | 10,162 | 224 | 215 |
| - = No Data Reported; -- = Not Applicable; NA = Not Available; W = Withheld to avoid disclosure of individual company data. |
| Release Date: 6/28/2024 |
| Next Release Date: 8/30/2024 |