|
Download Data (XLS File) |
|
||||||||
|
||||||||
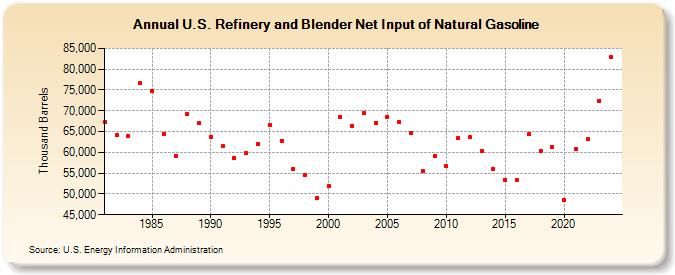
| U.S. Refinery and Blender Net Input of Natural Gasoline (Thousand Barrels) | ||||||||
| Decade | Year-0 | Year-1 | Year-2 | Year-3 | Year-4 | Year-5 | Year-6 | Year-7 | Year-8 | Year-9 |
|---|---|---|---|---|---|---|---|---|---|---|
| 1980's | 67,330 | 64,123 | 63,921 | 76,636 | 74,806 | 64,519 | 59,129 | 69,238 | 67,089 | |
| 1990's | 63,810 | 61,432 | 58,753 | 59,752 | 62,001 | 66,690 | 62,738 | 55,950 | 54,627 | 48,974 |
| 2000's | 51,882 | 68,523 | 66,449 | 69,509 | 67,112 | 68,600 | 67,312 | 64,603 | 55,497 | 59,100 |
| 2010's | 56,686 | 63,385 | 63,596 | 60,394 | 56,037 | 53,465 | 53,254 | 64,490 | 60,424 | 61,200 |
| 2020's | 48,599 | 60,739 | 63,122 | 72,287 |
| - = No Data Reported; -- = Not Applicable; NA = Not Available; W = Withheld to avoid disclosure of individual company data. |
| Release Date: 6/28/2024 |
| Next Release Date: 8/30/2024 |