|
Download Data (XLS File) |
|
||||||||
|
||||||||
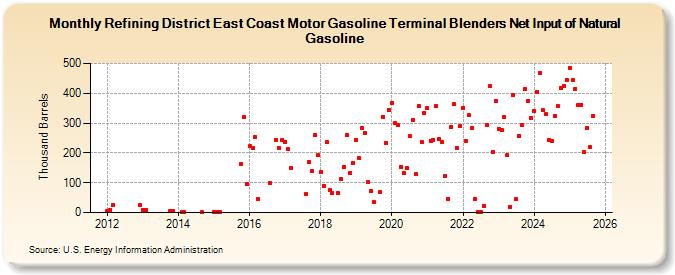
| Refining District East Coast Motor Gasoline Terminal Blenders Net Input of Natural Gasoline (Thousand Barrels) | ||||||||
| Year | Jan | Feb | Mar | Apr | May | Jun | Jul | Aug | Sep | Oct | Nov | Dec |
|---|---|---|---|---|---|---|---|---|---|---|---|---|
| 2012 | 5 | 9 | 25 | 24 | ||||||||
| 2013 | 10 | 9 | 4 | 4 | ||||||||
| 2014 | 2 | 2 | 1 | |||||||||
| 2015 | 2 | 1 | 2 | 162 | 321 | 95 | ||||||
| 2016 | 222 | 217 | 253 | 45 | 98 | 244 | 216 | 244 | ||||
| 2017 | 238 | 212 | 151 | 62 | 169 | 138 | 260 | 193 | ||||
| 2018 | 137 | 90 | 235 | 74 | 66 | 64 | 111 | 154 | 259 | 134 | 165 | |
| 2019 | 245 | 182 | 284 | 266 | 102 | 73 | 36 | 68 | 322 | 233 | 345 | |
| 2020 | 368 | 299 | 295 | 154 | 133 | 148 | 258 | 310 | 129 | 357 | 235 | 335 |
| 2021 | 350 | 241 | 245 | 358 | 248 | 235 | 123 | 46 | 286 | 363 | 218 | 289 |
| 2022 | 351 | 240 | 327 | 283 | 44 | 1 | 1 | 23 | 295 | 424 | 204 | 374 |
| 2023 | 281 | 276 | 316 | 192 | 20 | 393 | 44 | 258 | 292 | 413 | 375 | 317 |
| 2024 | 341 | |||||||||||
| - = No Data Reported; -- = Not Applicable; NA = Not Available; W = Withheld to avoid disclosure of individual company data. |
| Release Date: 3/29/2024 |
| Next Release Date: 4/30/2024 |
Referring Pages: