|
Download Data (XLS File) |
|
||||||||
|
||||||||
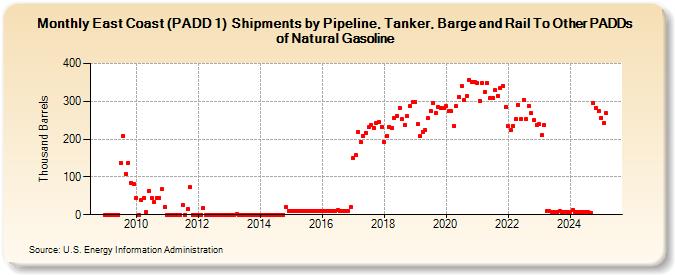
| East Coast (PADD 1) Shipments by Pipeline, Tanker, Barge and Rail To Other PADDs of Natural Gasoline (Thousand Barrels) | ||||||||
| Year | Jan | Feb | Mar | Apr | May | Jun | Jul | Aug | Sep | Oct | Nov | Dec |
|---|---|---|---|---|---|---|---|---|---|---|---|---|
| 2009 | 0 | 0 | 0 | 0 | 0 | 0 | 138 | 208 | 109 | 137 | 84 | 80 |
| 2010 | 45 | 0 | 40 | 44 | 7 | 64 | 43 | 33 | 44 | 45 | 67 | 20 |
| 2011 | 0 | 0 | 0 | 0 | 0 | 0 | 25 | 0 | 15 | 73 | 0 | 0 |
| 2012 | 0 | 0 | 19 | 0 | 0 | 0 | 0 | 0 | 0 | 0 | 0 | 0 |
| 2013 | 0 | 0 | 0 | 2 | 0 | 0 | 0 | 0 | 0 | 0 | 0 | 0 |
| 2014 | 0 | 0 | 0 | 0 | 0 | 0 | 0 | 0 | 0 | 0 | 20 | 10 |
| 2015 | 10 | 9 | 10 | 10 | 10 | 10 | 10 | 10 | 11 | 10 | 10 | 11 |
| 2016 | 10 | 10 | 10 | 10 | 10 | 11 | 12 | 11 | 11 | 11 | 10 | 21 |
| 2017 | 151 | 157 | 220 | 192 | 207 | 217 | 231 | 237 | 230 | 243 | 245 | 233 |
| 2018 | 192 | 209 | 233 | 230 | 256 | 262 | 283 | 253 | 238 | 260 | 287 | 297 |
| 2019 | 299 | 239 | 207 | 220 | 224 | 257 | 275 | 296 | 268 | 285 | 281 | 281 |
| 2020 | 287 | 273 | 273 | 235 | 287 | 312 | 341 | 303 | 314 | 357 | 350 | 351 |
| 2021 | 349 | 301 | 348 | 325 | 348 | 308 | 308 | 329 | 315 | 335 | 341 | 285 |
| 2022 | 235 | 223 | 235 | 252 | 291 | 252 | 304 | 253 | 288 | 268 | 250 | 238 |
| 2023 | 239 | 210 | 238 | 9 | 9 | 7 | 6 | 7 | 9 | 6 | 7 | 7 |
| 2024 | 6 | |||||||||||
| - = No Data Reported; -- = Not Applicable; NA = Not Available; W = Withheld to avoid disclosure of individual company data. |
| Release Date: 3/29/2024 |
| Next Release Date: 4/30/2024 |