|
Download Data (XLS File) |
|
||||||||
|
||||||||
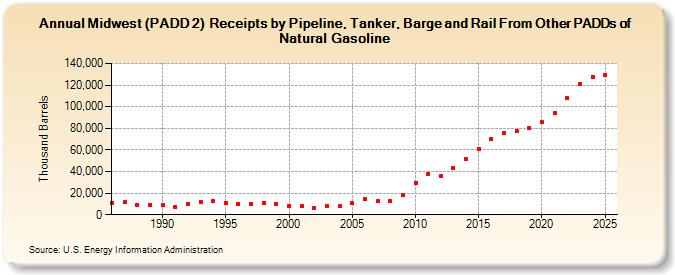
| Midwest (PADD 2) Receipts by Pipeline, Tanker, Barge and Rail From Other PADDs of Natural Gasoline (Thousand Barrels) | ||||||||
| Decade | Year-0 | Year-1 | Year-2 | Year-3 | Year-4 | Year-5 | Year-6 | Year-7 | Year-8 | Year-9 |
|---|---|---|---|---|---|---|---|---|---|---|
| 1980's | 11,132 | 11,405 | 8,794 | 9,333 | ||||||
| 1990's | 8,900 | 7,559 | 10,213 | 12,060 | 12,393 | 11,062 | 9,848 | 10,214 | 11,051 | 9,489 |
| 2000's | 8,234 | 8,023 | 6,240 | 7,974 | 7,691 | 10,551 | 14,488 | 12,597 | 12,495 | 18,166 |
| 2010's | 29,151 | 38,041 | 35,669 | 43,074 | 51,956 | 61,080 | 70,033 | 75,543 | 77,866 | 79,919 |
| 2020's | 85,555 | 94,200 | 107,894 | 120,575 |
| - = No Data Reported; -- = Not Applicable; NA = Not Available; W = Withheld to avoid disclosure of individual company data. |
| Release Date: 3/29/2024 |
| Next Release Date: 8/30/2024 |