|
Download Data (XLS File) |
|
||||||||
|
||||||||
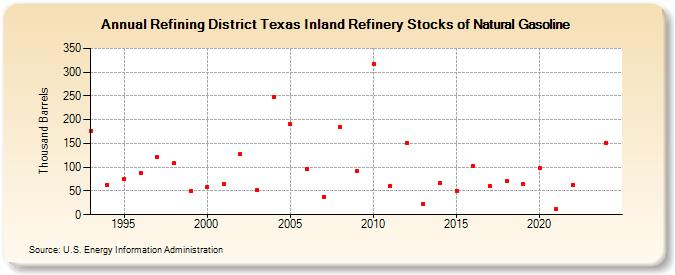
| Refining District Texas Inland Refinery Stocks of Natural Gasoline (Thousand Barrels) | ||||||||
| Decade | Year-0 | Year-1 | Year-2 | Year-3 | Year-4 | Year-5 | Year-6 | Year-7 | Year-8 | Year-9 |
|---|---|---|---|---|---|---|---|---|---|---|
| 1990's | 177 | 63 | 76 | 88 | 121 | 108 | 49 | |||
| 2000's | 58 | 65 | 128 | 53 | 247 | 190 | 96 | 38 | 185 | 91 |
| 2010's | 318 | 60 | 150 | 23 | 67 | 50 | 102 | 60 | 71 | 64 |
| 2020's | 98 | 12 | 63 |
| - = No Data Reported; -- = Not Applicable; NA = Not Available; W = Withheld to avoid disclosure of individual company data. |
| Release Date: 3/29/2024 |
| Next Release Date: 8/30/2024 |
Referring Pages: