|
Download Data (XLS File) |
|
||||||||
|
||||||||
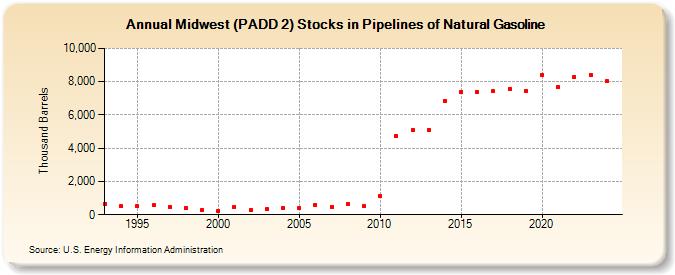
| Midwest (PADD 2) Stocks in Pipelines of Natural Gasoline (Thousand Barrels) | ||||||||
| Decade | Year-0 | Year-1 | Year-2 | Year-3 | Year-4 | Year-5 | Year-6 | Year-7 | Year-8 | Year-9 |
|---|---|---|---|---|---|---|---|---|---|---|
| 1990's | 668 | 501 | 510 | 558 | 478 | 428 | 297 | |||
| 2000's | 234 | 489 | 260 | 315 | 414 | 396 | 589 | 491 | 618 | 504 |
| 2010's | 1,130 | 4,740 | 5,100 | 5,097 | 6,858 | 7,400 | 7,383 | 7,410 | 7,580 | 7,456 |
| 2020's | 8,419 | 7,693 | 8,279 | 8,421 |
| - = No Data Reported; -- = Not Applicable; NA = Not Available; W = Withheld to avoid disclosure of individual company data. |
| Release Date: 3/29/2024 |
| Next Release Date: 8/30/2024 |