|
Download Data (XLS File) |
|
||||||||
|
||||||||
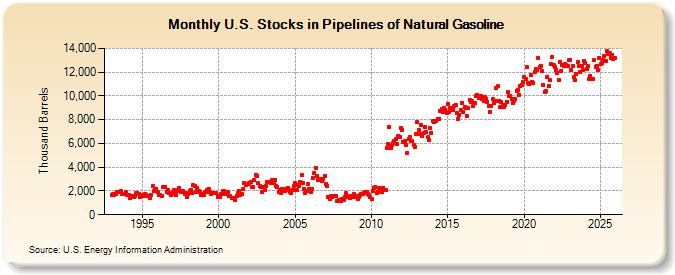
| U.S. Stocks in Pipelines of Natural Gasoline (Thousand Barrels) | ||||||||
| Year | Jan | Feb | Mar | Apr | May | Jun | Jul | Aug | Sep | Oct | Nov | Dec |
|---|---|---|---|---|---|---|---|---|---|---|---|---|
| 1993 | 1,649 | 1,742 | 1,692 | 1,721 | 1,914 | 1,877 | 1,916 | 2,008 | 1,711 | 1,734 | 1,783 | 1,878 |
| 1994 | 1,670 | 1,665 | 1,373 | 1,556 | 1,611 | 1,530 | 1,578 | 1,859 | 1,789 | 1,772 | 1,452 | 1,553 |
| 1995 | 1,641 | 1,602 | 1,740 | 1,698 | 1,568 | 1,553 | 1,397 | 1,652 | 2,376 | 1,992 | 2,118 | 2,171 |
| 1996 | 1,915 | 1,630 | 1,701 | 1,565 | 2,296 | 2,367 | 2,359 | 1,919 | 2,040 | 1,789 | 1,672 | 1,732 |
| 1997 | 1,871 | 2,089 | 1,681 | 1,998 | 2,078 | 2,246 | 1,896 | 2,001 | 1,976 | 1,722 | 1,848 | 1,502 |
| 1998 | 1,775 | 1,995 | 2,112 | 1,805 | 2,483 | 2,406 | 1,899 | 2,251 | 2,018 | 1,886 | 1,697 | 1,754 |
| 1999 | 1,652 | 1,942 | 1,912 | 2,085 | 2,206 | 1,904 | 1,738 | 1,790 | 1,797 | 1,807 | 1,793 | 1,527 |
| 2000 | 1,559 | 1,527 | 1,731 | 1,984 | 1,996 | 1,762 | 1,805 | 1,904 | 1,539 | 1,543 | 1,422 | 1,390 |
| 2001 | 1,445 | 1,230 | 1,601 | 1,788 | 1,979 | 1,656 | 1,734 | 2,146 | 2,641 | 2,523 | 2,563 | 2,592 |
| 2002 | 2,690 | 2,757 | 2,365 | 2,360 | 2,891 | 3,324 | 3,240 | 2,634 | 2,446 | 2,312 | 1,949 | 2,360 |
| 2003 | 2,051 | 2,432 | 2,784 | 2,768 | 2,759 | 2,673 | 2,929 | 2,704 | 2,906 | 2,417 | 2,295 | 1,909 |
| 2004 | 2,055 | 1,861 | 2,161 | 2,070 | 2,024 | 2,154 | 2,287 | 2,114 | 1,894 | 1,822 | 2,087 | 2,459 |
| 2005 | 2,649 | 2,091 | 2,510 | 2,457 | 2,791 | 3,312 | 2,632 | 2,169 | 1,867 | 2,005 | 2,581 | 2,153 |
| 2006 | 1,915 | 2,140 | 3,095 | 3,532 | 3,948 | 3,230 | 2,949 | 2,886 | 3,041 | 2,807 | 3,035 | 3,246 |
| 2007 | 2,592 | 2,439 | 1,498 | 1,351 | 1,549 | 1,515 | 1,610 | 1,599 | 1,540 | 1,153 | 1,240 | 1,219 |
| 2008 | 1,118 | 1,304 | 1,271 | 1,489 | 1,790 | 1,602 | 1,504 | 1,415 | 1,540 | 1,492 | 1,729 | 1,516 |
| 2009 | 1,543 | 1,303 | 1,458 | 1,672 | 1,723 | 1,734 | 1,851 | 1,918 | 1,892 | 1,765 | 1,647 | 1,453 |
| 2010 | 1,332 | 1,989 | 2,274 | 2,321 | 1,805 | 1,953 | 2,256 | 2,050 | 1,924 | 2,282 | 2,097 | 2,067 |
| 2011 | 5,605 | 5,938 | 7,390 | 5,649 | 5,869 | 6,001 | 6,222 | 6,351 | 5,916 | 6,661 | 6,523 | 7,335 |
| 2012 | 7,168 | 6,138 | 6,193 | 5,899 | 5,218 | 6,363 | 6,562 | 6,187 | 6,182 | 5,875 | 5,739 | 6,756 |
| 2013 | 7,770 | 7,125 | 6,762 | 7,571 | 6,631 | 6,894 | 7,346 | 6,958 | 6,518 | 6,273 | 7,296 | 6,888 |
| 2014 | 7,865 | 7,838 | 7,906 | 7,875 | 8,097 | 8,073 | 8,706 | 8,873 | 8,672 | 8,968 | 8,802 | 8,587 |
| 2015 | 9,340 | 8,608 | 8,979 | 8,982 | 8,838 | 9,168 | 9,266 | 8,527 | 8,065 | 8,397 | 8,834 | 9,384 |
| 2016 | 8,649 | 9,054 | 8,981 | 8,320 | 8,941 | 9,642 | 9,471 | 9,555 | 9,183 | 9,415 | 9,991 | 10,071 |
| 2017 | 9,786 | 9,935 | 10,028 | 9,775 | 9,558 | 9,922 | 9,781 | 9,522 | 9,162 | 8,678 | 9,174 | 9,718 |
| 2018 | 9,381 | 9,591 | 10,634 | 10,799 | 9,591 | 9,044 | 9,487 | 9,217 | 9,065 | 9,210 | 9,511 | 10,355 |
| 2019 | 10,026 | 9,974 | 9,770 | 9,369 | 9,595 | 9,728 | 10,440 | 10,502 | 10,097 | 10,845 | 10,882 | 11,170 |
| 2020 | 11,610 | 11,405 | 12,428 | 11,126 | 11,008 | 11,770 | 11,177 | 11,089 | 12,047 | 12,259 | 12,179 | 13,193 |
| 2021 | 12,414 | 12,540 | 12,089 | 10,917 | 10,354 | 10,397 | 11,568 | 10,851 | 11,306 | 12,665 | 13,305 | 12,565 |
| 2022 | 12,422 | 12,207 | 11,921 | 11,333 | 12,866 | 12,103 | 12,565 | 12,522 | 12,669 | 12,561 | 12,531 | 12,984 |
| 2023 | 13,038 | 12,195 | 12,514 | 11,583 | 11,299 | 11,870 | 12,836 | 12,529 | 12,249 | 12,549 | 12,171 | 12,930 |
| 2024 | 12,731 | |||||||||||
| - = No Data Reported; -- = Not Applicable; NA = Not Available; W = Withheld to avoid disclosure of individual company data. |
| Release Date: 3/29/2024 |
| Next Release Date: 4/30/2024 |