|
Download Data (XLS File) |
|
||||||||
|
||||||||
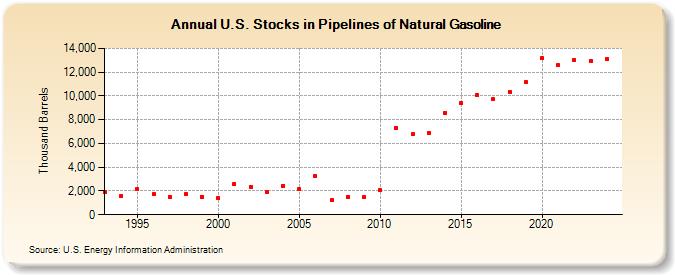
| U.S. Stocks in Pipelines of Natural Gasoline (Thousand Barrels) | ||||||||
| Decade | Year-0 | Year-1 | Year-2 | Year-3 | Year-4 | Year-5 | Year-6 | Year-7 | Year-8 | Year-9 |
|---|---|---|---|---|---|---|---|---|---|---|
| 1990's | 1,878 | 1,553 | 2,171 | 1,732 | 1,502 | 1,754 | 1,527 | |||
| 2000's | 1,390 | 2,592 | 2,360 | 1,909 | 2,459 | 2,153 | 3,246 | 1,219 | 1,516 | 1,453 |
| 2010's | 2,067 | 7,335 | 6,756 | 6,888 | 8,587 | 9,384 | 10,071 | 9,718 | 10,355 | 11,170 |
| 2020's | 13,193 | 12,565 | 12,984 | 12,930 |
| - = No Data Reported; -- = Not Applicable; NA = Not Available; W = Withheld to avoid disclosure of individual company data. |
| Release Date: 3/29/2024 |
| Next Release Date: 8/30/2024 |