|
Download Data (XLS File) |
|
||||||||
|
||||||||
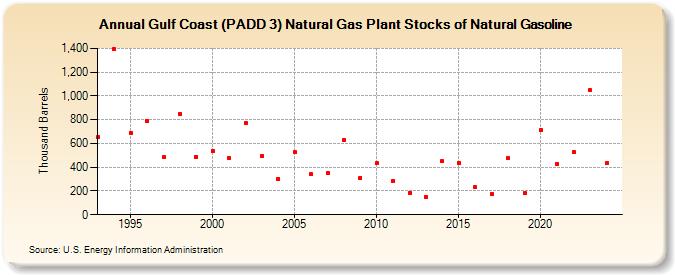
| Gulf Coast (PADD 3) Natural Gas Plant Stocks of Natural Gasoline (Thousand Barrels) | ||||||||
| Decade | Year-0 | Year-1 | Year-2 | Year-3 | Year-4 | Year-5 | Year-6 | Year-7 | Year-8 | Year-9 |
|---|---|---|---|---|---|---|---|---|---|---|
| 1990's | 653 | 1,394 | 691 | 787 | 483 | 847 | 488 | |||
| 2000's | 537 | 474 | 773 | 495 | 304 | 525 | 339 | 351 | 633 | 313 |
| 2010's | 433 | 283 | 185 | 151 | 450 | 434 | 231 | 173 | 474 | 180 |
| 2020's | 715 | 428 | 529 | 1,046 |
| - = No Data Reported; -- = Not Applicable; NA = Not Available; W = Withheld to avoid disclosure of individual company data. |
| Release Date: 3/29/2024 |
| Next Release Date: 8/30/2024 |