|
Download Data (XLS File) |
|
||||||||
|
||||||||
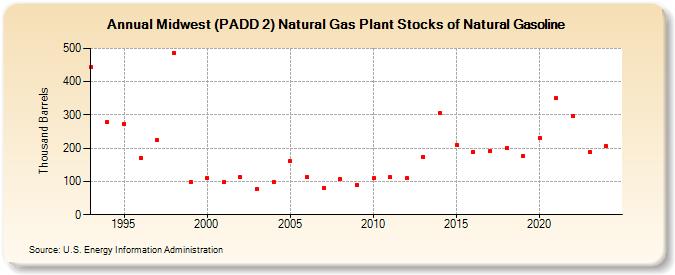
| Midwest (PADD 2) Natural Gas Plant Stocks of Natural Gasoline (Thousand Barrels) | ||||||||
| Decade | Year-0 | Year-1 | Year-2 | Year-3 | Year-4 | Year-5 | Year-6 | Year-7 | Year-8 | Year-9 |
|---|---|---|---|---|---|---|---|---|---|---|
| 1990's | 443 | 279 | 273 | 170 | 224 | 487 | 98 | |||
| 2000's | 111 | 97 | 112 | 77 | 99 | 161 | 113 | 79 | 107 | 90 |
| 2010's | 109 | 112 | 109 | 174 | 306 | 211 | 189 | 191 | 200 | 176 |
| 2020's | 231 | 350 | 297 | 186 |
| - = No Data Reported; -- = Not Applicable; NA = Not Available; W = Withheld to avoid disclosure of individual company data. |
| Release Date: 3/29/2024 |
| Next Release Date: 8/30/2024 |