|
Download Data (XLS File) |
|
||||||||
|
||||||||
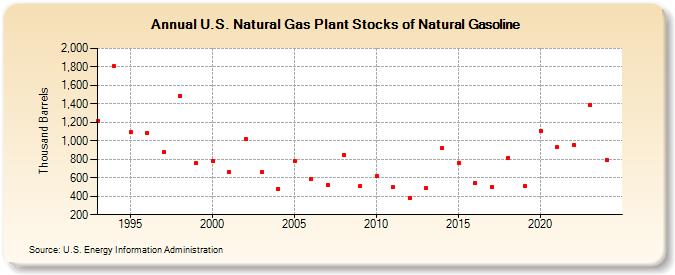
| U.S. Natural Gas Plant Stocks of Natural Gasoline (Thousand Barrels) | ||||||||
| Decade | Year-0 | Year-1 | Year-2 | Year-3 | Year-4 | Year-5 | Year-6 | Year-7 | Year-8 | Year-9 |
|---|---|---|---|---|---|---|---|---|---|---|
| 1990's | 1,212 | 1,806 | 1,090 | 1,081 | 880 | 1,488 | 757 | |||
| 2000's | 782 | 663 | 1,018 | 663 | 481 | 776 | 590 | 522 | 847 | 513 |
| 2010's | 619 | 501 | 383 | 486 | 924 | 763 | 545 | 505 | 818 | 512 |
| 2020's | 1,109 | 929 | 959 | 1,379 |
| - = No Data Reported; -- = Not Applicable; NA = Not Available; W = Withheld to avoid disclosure of individual company data. |
| Release Date: 3/29/2024 |
| Next Release Date: 8/30/2024 |