|
Download Data (XLS File) |
|
||||||||
|
||||||||
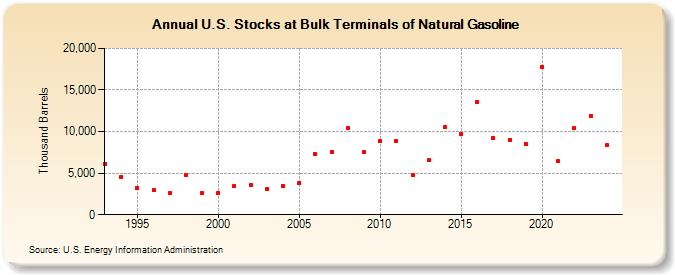
| U.S. Stocks at Bulk Terminals of Natural Gasoline (Thousand Barrels) | ||||||||
| Decade | Year-0 | Year-1 | Year-2 | Year-3 | Year-4 | Year-5 | Year-6 | Year-7 | Year-8 | Year-9 |
|---|---|---|---|---|---|---|---|---|---|---|
| 1990's | 6,149 | 4,523 | 3,218 | 2,997 | 2,641 | 4,778 | 2,653 | |||
| 2000's | 2,653 | 3,406 | 3,573 | 3,118 | 3,462 | 3,868 | 7,289 | 7,588 | 10,415 | 7,509 |
| 2010's | 8,853 | 8,865 | 4,716 | 6,533 | 10,517 | 9,651 | 13,536 | 9,278 | 9,023 | 8,562 |
| 2020's | 17,744 | 6,405 | 10,412 | 11,929 |
| - = No Data Reported; -- = Not Applicable; NA = Not Available; W = Withheld to avoid disclosure of individual company data. |
| Release Date: 3/29/2024 |
| Next Release Date: 8/30/2024 |