|
Download Data (XLS File) |
|
||||||||
|
||||||||
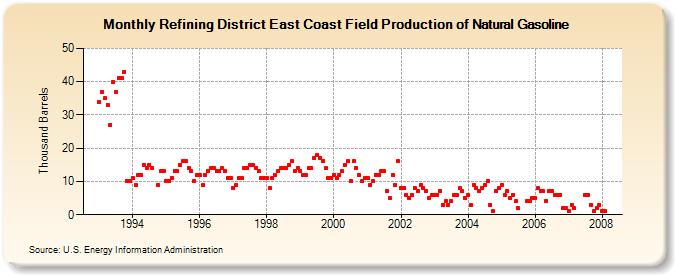
| Refining District East Coast Field Production of Natural Gasoline (Thousand Barrels) | ||||||||
| Year | Jan | Feb | Mar | Apr | May | Jun | Jul | Aug | Sep | Oct | Nov | Dec |
|---|---|---|---|---|---|---|---|---|---|---|---|---|
| 1993 | 34 | 37 | 35 | 33 | 27 | 40 | 37 | 41 | 41 | 43 | 10 | 10 |
| 1994 | 11 | 9 | 12 | 12 | 15 | 14 | 15 | 14 | 9 | 13 | 13 | |
| 1995 | 10 | 10 | 11 | 13 | 13 | 15 | 16 | 16 | 14 | 13 | 10 | 12 |
| 1996 | 12 | 9 | 12 | 13 | 14 | 14 | 13 | 13 | 14 | 13 | 11 | 11 |
| 1997 | 8 | 9 | 11 | 11 | 14 | 14 | 15 | 15 | 14 | 13 | 11 | 11 |
| 1998 | 11 | 8 | 11 | 12 | 13 | 14 | 14 | 14 | 15 | 16 | 13 | 14 |
| 1999 | 13 | 12 | 12 | 14 | 14 | 17 | 18 | 17 | 16 | 14 | 11 | 11 |
| 2000 | 12 | 11 | 12 | 13 | 15 | 16 | 10 | 16 | 14 | 12 | 10 | 11 |
| 2001 | 11 | 9 | 10 | 12 | 12 | 13 | 13 | 7 | 5 | 12 | 9 | 16 |
| 2002 | 8 | 8 | 6 | 5 | 6 | 8 | 7 | 9 | 8 | 7 | 5 | 6 |
| 2003 | 6 | 6 | 7 | 3 | 4 | 3 | 4 | 6 | 6 | 8 | 7 | 5 |
| 2004 | 6 | 3 | 9 | 8 | 7 | 8 | 9 | 10 | 3 | 1 | 7 | 8 |
| 2005 | 9 | 6 | 7 | 5 | 6 | 4 | 2 | 4 | 4 | 5 | ||
| 2006 | 5 | 8 | 7 | 7 | 4 | 7 | 7 | 6 | 6 | 6 | 2 | 2 |
| 2007 | 1 | 3 | 2 | 6 | 6 | 3 | 1 | 2 | 3 | |||
| 2008 | 1 | 1 | ||||||||||
| - = No Data Reported; -- = Not Applicable; NA = Not Available; W = Withheld to avoid disclosure of individual company data. |
| Release Date: 6/28/2024 |
| Next Release Date: 7/31/2024 |