|
Download Data (XLS File) |
|
||||||||
|
||||||||
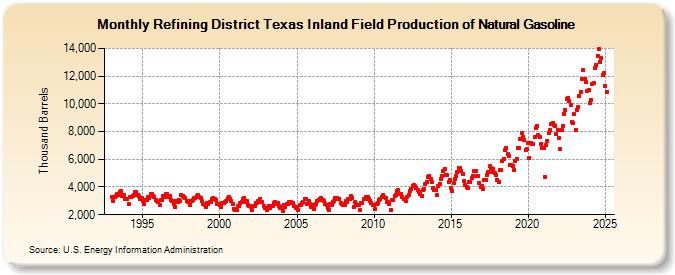
| Refining District Texas Inland Field Production of Natural Gasoline (Thousand Barrels) | ||||||||
| Year | Jan | Feb | Mar | Apr | May | Jun | Jul | Aug | Sep | Oct | Nov | Dec |
|---|---|---|---|---|---|---|---|---|---|---|---|---|
| 1993 | 3,253 | 2,959 | 3,308 | 3,329 | 3,486 | 3,452 | 3,672 | 3,704 | 3,383 | 3,424 | 3,112 | 3,119 |
| 1994 | 3,116 | 2,780 | 3,266 | 3,258 | 3,316 | 3,441 | 3,634 | 3,644 | 3,425 | 3,343 | 3,156 | 3,195 |
| 1995 | 2,973 | 2,748 | 3,040 | 3,076 | 3,274 | 3,193 | 3,468 | 3,519 | 3,342 | 3,296 | 3,091 | 2,985 |
| 1996 | 2,906 | 2,708 | 3,029 | 3,044 | 3,337 | 3,275 | 3,502 | 3,462 | 3,294 | 3,362 | 3,057 | 3,013 |
| 1997 | 2,795 | 2,580 | 2,985 | 2,925 | 3,036 | 3,021 | 3,389 | 3,371 | 3,271 | 3,203 | 2,976 | 2,944 |
| 1998 | 2,992 | 2,705 | 2,980 | 3,083 | 3,194 | 3,231 | 3,343 | 3,389 | 3,258 | 3,181 | 2,961 | 2,752 |
| 1999 | 2,719 | 2,531 | 2,815 | 2,777 | 2,917 | 2,931 | 3,136 | 3,171 | 3,102 | 3,049 | 2,785 | 2,779 |
| 2000 | 2,673 | 2,578 | 2,823 | 2,815 | 2,931 | 3,003 | 3,188 | 3,244 | 3,117 | 2,983 | 2,766 | 2,411 |
| 2001 | 2,337 | 2,322 | 2,660 | 2,650 | 2,821 | 2,945 | 3,104 | 3,186 | 2,941 | 2,981 | 2,731 | 2,640 |
| 2002 | 2,523 | 2,343 | 2,656 | 2,658 | 2,830 | 2,853 | 3,004 | 3,109 | 2,941 | 2,912 | 2,647 | 2,505 |
| 2003 | 2,466 | 2,308 | 2,629 | 2,520 | 2,664 | 2,656 | 2,856 | 2,908 | 2,782 | 2,813 | 2,659 | 2,496 |
| 2004 | 2,527 | 2,268 | 2,672 | 2,591 | 2,749 | 2,789 | 2,951 | 2,911 | 2,846 | 2,840 | 2,608 | 2,491 |
| 2005 | 2,545 | 2,355 | 2,679 | 2,735 | 2,853 | 2,882 | 3,147 | 3,101 | 2,740 | 2,956 | 2,741 | 2,570 |
| 2006 | 2,730 | 2,377 | 2,713 | 2,761 | 2,969 | 3,049 | 3,163 | 3,183 | 3,084 | 3,019 | 2,798 | 2,733 |
| 2007 | 2,505 | 2,341 | 2,773 | 2,680 | 2,935 | 3,014 | 3,195 | 3,222 | 3,130 | 3,139 | 2,839 | 2,786 |
| 2008 | 2,734 | 2,727 | 2,962 | 2,922 | 3,160 | 3,145 | 3,315 | 3,235 | 2,556 | 2,907 | 2,750 | 2,711 |
| 2009 | 2,706 | 2,372 | 2,819 | 2,880 | 3,116 | 3,129 | 3,299 | 3,298 | 3,110 | 3,018 | 2,820 | 2,665 |
| 2010 | 2,728 | 2,406 | 2,797 | 2,847 | 3,064 | 3,151 | 3,299 | 3,399 | 3,278 | 3,202 | 2,924 | 2,892 |
| 2011 | 2,771 | 2,340 | 3,056 | 3,061 | 3,371 | 3,455 | 3,738 | 3,750 | 3,504 | 3,521 | 3,297 | 3,127 |
| 2012 | 3,165 | 2,957 | 3,305 | 3,414 | 3,729 | 3,838 | 4,106 | 4,149 | 4,057 | 3,940 | 3,793 | 3,661 |
| 2013 | 3,527 | 3,356 | 3,772 | 3,822 | 4,210 | 4,356 | 4,690 | 4,773 | 4,586 | 4,355 | 3,909 | 3,810 |
| 2014 | 3,777 | 3,411 | 4,039 | 4,249 | 4,582 | 4,780 | 5,118 | 5,308 | 4,879 | 4,849 | 4,351 | 4,533 |
| 2015 | 3,912 | 3,721 | 4,277 | 4,563 | 4,763 | 5,050 | 5,384 | 5,367 | 5,180 | 4,972 | 4,432 | 4,152 |
| 2016 | 3,978 | 3,906 | 4,351 | 4,343 | 4,660 | 4,811 | 5,176 | 5,141 | 4,792 | 4,760 | 4,267 | 3,999 |
| 2017 | 4,071 | 3,889 | 4,510 | 4,503 | 4,883 | 5,087 | 5,481 | 5,379 | 5,097 | 5,281 | 4,988 | 4,837 |
| 2018 | 4,530 | 4,343 | 5,211 | 5,209 | 5,876 | 6,031 | 6,638 | 6,794 | 6,380 | 6,223 | 5,604 | 5,621 |
| 2019 | 5,498 | 5,228 | 5,874 | 6,003 | 6,804 | 6,799 | 7,483 | 7,866 | 7,637 | 7,361 | 6,679 | 6,724 |
| 2020 | 7,154 | 6,108 | 7,176 | 7,067 | 7,076 | 7,599 | 8,290 | 8,395 | 7,717 | 7,617 | 7,093 | 6,836 |
| 2021 | 6,832 | 4,723 | 6,997 | 7,342 | 7,875 | 8,089 | 8,550 | 8,598 | 8,449 | 8,423 | 7,816 | 8,078 |
| 2022 | 7,526 | 6,752 | 8,136 | 8,372 | 9,301 | 9,522 | 10,352 | 10,452 | 10,239 | 9,942 | 8,682 | 8,603 |
| 2023 | 8,603 | 7,584 | 9,113 | 9,253 | 10,317 | 10,454 | 11,483 | 12,016 | 11,604 | 11,311 | 10,681 | 10,788 |
| 2024 | 10,028 | |||||||||||
| - = No Data Reported; -- = Not Applicable; NA = Not Available; W = Withheld to avoid disclosure of individual company data. |
| Release Date: 3/29/2024 |
| Next Release Date: 4/30/2024 |