|
Download Data (XLS File) |
|
||||||||
|
||||||||
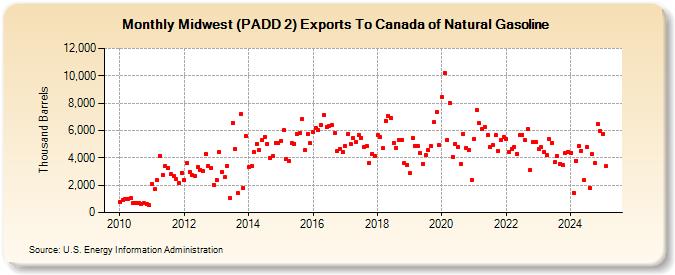
| Midwest (PADD 2) Exports To Canada of Natural Gasoline (Thousand Barrels) | ||||||||
| Year | Jan | Feb | Mar | Apr | May | Jun | Jul | Aug | Sep | Oct | Nov | Dec |
|---|---|---|---|---|---|---|---|---|---|---|---|---|
| 2010 | 785 | 904 | 959 | 1,013 | 1,046 | 720 | 701 | 718 | 609 | 664 | 660 | 526 |
| 2011 | 2,064 | 1,688 | 2,377 | 4,162 | 2,772 | 3,372 | 3,223 | 2,796 | 2,636 | 2,451 | 2,155 | 2,912 |
| 2012 | 2,357 | 3,600 | 2,963 | 2,715 | 2,698 | 3,312 | 3,137 | 3,054 | 4,301 | 3,413 | 3,232 | 2,042 |
| 2013 | 2,393 | 4,419 | 2,961 | 2,564 | 3,417 | 1,080 | 6,566 | 4,644 | 1,429 | 7,200 | 1,790 | 5,602 |
| 2014 | 3,347 | 3,400 | 4,399 | 5,034 | 4,605 | 5,280 | 5,547 | 5,032 | 3,988 | 4,143 | 5,092 | 5,059 |
| 2015 | 5,241 | 6,021 | 3,924 | 3,754 | 5,074 | 5,032 | 5,769 | 5,824 | 6,831 | 4,544 | 5,773 | 5,048 |
| 2016 | 5,906 | 6,206 | 6,003 | 6,368 | 7,133 | 6,251 | 6,359 | 6,414 | 5,803 | 4,515 | 4,634 | 4,393 |
| 2017 | 4,861 | 5,742 | 5,012 | 5,436 | 5,162 | 5,665 | 5,462 | 4,804 | 4,851 | 3,641 | 4,299 | 4,109 |
| 2018 | 5,691 | 5,515 | 4,685 | 6,721 | 7,091 | 6,930 | 5,105 | 4,721 | 5,321 | 5,324 | 3,622 | 3,509 |
| 2019 | 2,869 | 5,485 | 4,901 | 4,831 | 4,341 | 3,555 | 4,176 | 4,537 | 4,878 | 6,600 | 7,345 | 4,926 |
| 2020 | 8,434 | 10,193 | 5,307 | 7,996 | 4,065 | 5,044 | 4,808 | 3,570 | 5,761 | 4,741 | 4,555 | 2,411 |
| 2021 | 5,401 | 7,463 | 6,510 | 6,092 | 6,242 | 5,646 | 4,803 | 4,966 | 5,639 | 4,533 | 5,282 | 5,532 |
| 2022 | 5,401 | 4,437 | 4,657 | 4,805 | 4,313 | 5,644 | 5,705 | 5,310 | 6,097 | 3,127 | 5,148 | 5,124 |
| 2023 | 4,454 | 4,352 | 3,876 | 4,239 | 1,642 | 1,828 | 1,601 | 1,278 | 1,385 | 1,097 | 4,331 | 4,426 |
| 2024 | 4,375 | |||||||||||
| - = No Data Reported; -- = Not Applicable; NA = Not Available; W = Withheld to avoid disclosure of individual company data. |
| Release Date: 3/29/2024 |
| Next Release Date: 4/30/2024 |