|
Download Data (XLS File) |
|
||||||||
|
||||||||
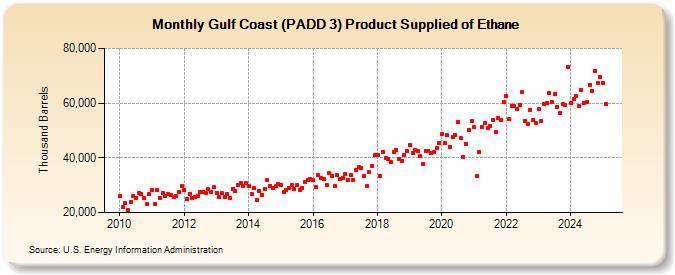
| Gulf Coast (PADD 3) Product Supplied of Ethane (Thousand Barrels) | ||||||||
| Year | Jan | Feb | Mar | Apr | May | Jun | Jul | Aug | Sep | Oct | Nov | Dec |
|---|---|---|---|---|---|---|---|---|---|---|---|---|
| 2010 | 25,971 | 22,004 | 23,324 | 20,831 | 24,022 | 26,065 | 25,260 | 27,293 | 26,937 | 25,187 | 23,205 | 26,690 |
| 2011 | 28,404 | 23,285 | 28,188 | 25,211 | 27,117 | 26,077 | 26,788 | 26,353 | 25,602 | 26,170 | 27,649 | 29,834 |
| 2012 | 28,382 | 24,791 | 26,842 | 25,189 | 25,673 | 25,931 | 27,658 | 27,485 | 27,012 | 28,755 | 27,468 | 29,241 |
| 2013 | 27,158 | 25,597 | 27,045 | 25,748 | 26,817 | 25,278 | 28,655 | 27,960 | 30,218 | 30,891 | 29,815 | 30,698 |
| 2014 | 29,867 | 26,942 | 28,808 | 24,762 | 28,047 | 26,527 | 28,770 | 31,862 | 29,858 | 29,090 | 29,589 | 30,512 |
| 2015 | 30,026 | 27,380 | 28,113 | 29,014 | 29,907 | 28,521 | 29,942 | 28,109 | 29,026 | 31,024 | 31,812 | 32,284 |
| 2016 | 31,758 | 29,244 | 33,628 | 32,464 | 32,199 | 30,122 | 34,531 | 33,516 | 29,673 | 33,732 | 32,278 | 32,723 |
| 2017 | 34,233 | 31,762 | 33,562 | 31,945 | 35,610 | 36,621 | 36,379 | 33,414 | 29,527 | 34,722 | 37,143 | 40,934 |
| 2018 | 40,893 | 33,463 | 42,249 | 40,099 | 39,478 | 38,478 | 42,130 | 42,682 | 39,682 | 38,825 | 41,198 | 42,362 |
| 2019 | 44,761 | 41,922 | 43,002 | 42,626 | 40,671 | 37,719 | 42,667 | 42,513 | 41,799 | 41,979 | 43,469 | 45,558 |
| 2020 | 48,866 | 45,251 | 48,290 | 44,099 | 47,669 | 48,456 | 53,119 | 47,141 | 40,430 | 45,041 | 50,251 | 53,410 |
| 2021 | 51,115 | 33,316 | 42,220 | 51,301 | 52,771 | 50,982 | 51,773 | 53,883 | 49,358 | 54,640 | 53,739 | 60,572 |
| 2022 | 62,555 | 54,167 | 58,995 | 58,915 | 57,895 | 59,150 | 63,885 | 53,366 | 52,507 | 57,507 | 53,971 | 52,598 |
| 2023 | 55,831 | 51,299 | 57,671 | 58,770 | 63,381 | 61,702 | 63,187 | 57,419 | 55,036 | 59,900 | 59,167 | 72,009 |
| 2024 | 60,047 | |||||||||||
| - = No Data Reported; -- = Not Applicable; NA = Not Available; W = Withheld to avoid disclosure of individual company data. |
| Release Date: 3/29/2024 |
| Next Release Date: 4/30/2024 |