|
Download Data (XLS File) |
|
||||||||
|
||||||||
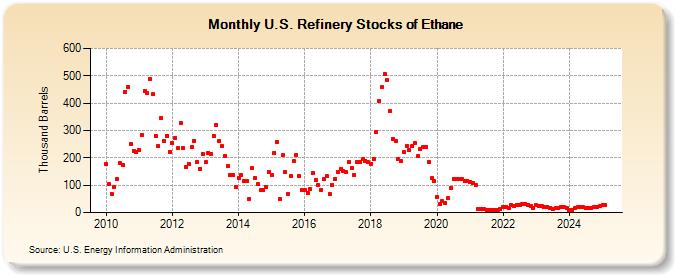
| U.S. Refinery Stocks of Ethane (Thousand Barrels) | ||||||||
| Year | Jan | Feb | Mar | Apr | May | Jun | Jul | Aug | Sep | Oct | Nov | Dec |
|---|---|---|---|---|---|---|---|---|---|---|---|---|
| 2010 | 177 | 103 | 69 | 92 | 123 | 180 | 175 | 442 | 459 | 251 | 226 | 220 |
| 2011 | 230 | 284 | 444 | 438 | 488 | 432 | 281 | 244 | 345 | 261 | 280 | 223 |
| 2012 | 255 | 274 | 235 | 329 | 236 | 167 | 178 | 238 | 263 | 184 | 161 | 214 |
| 2013 | 183 | 219 | 214 | 281 | 321 | 261 | 242 | 205 | 171 | 137 | 137 | 93 |
| 2014 | 126 | 137 | 116 | 114 | 51 | 162 | 127 | 104 | 83 | 84 | 95 | 150 |
| 2015 | 138 | 219 | 257 | 49 | 209 | 147 | 69 | 135 | 187 | 212 | 132 | 82 |
| 2016 | 81 | 72 | 86 | 144 | 118 | 100 | 84 | 122 | 132 | 69 | 101 | 122 |
| 2017 | 150 | 160 | 151 | 148 | 184 | 164 | 139 | 185 | 183 | 194 | 190 | 184 |
| 2018 | 179 | 196 | 295 | 407 | 458 | 507 | 484 | 371 | 270 | 263 | 194 | 188 |
| 2019 | 221 | 244 | 228 | 242 | 254 | 205 | 232 | 241 | 240 | 186 | 126 | 114 |
| 2020 | 56 | 30 | 41 | 35 | 53 | 90 | 121 | 123 | 124 | 122 | 116 | 116 |
| 2021 | 113 | 107 | 101 | 12 | 13 | 13 | 11 | 11 | 10 | 8 | 10 | 12 |
| 2022 | 20 | 22 | 17 | 26 | 25 | 26 | 29 | 31 | 31 | 29 | 23 | 18 |
| 2023 | 26 | 24 | 24 | 21 | 22 | 17 | 13 | 16 | 18 | 19 | 19 | 17 |
| 2024 | 11 | 11 | 16 | 19 | ||||||||
| - = No Data Reported; -- = Not Applicable; NA = Not Available; W = Withheld to avoid disclosure of individual company data. |
| Release Date: 6/28/2024 |
| Next Release Date: 7/31/2024 |