|
Download Data (XLS File) |
|
||||||||
|
||||||||
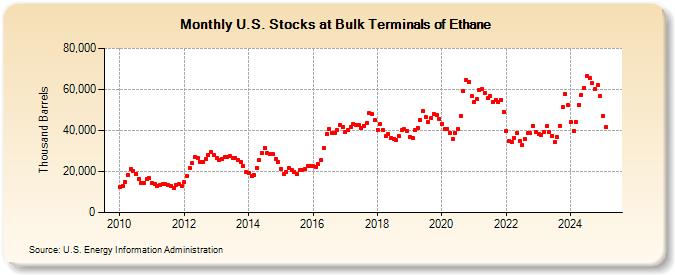
| U.S. Stocks at Bulk Terminals of Ethane (Thousand Barrels) | ||||||||
| Year | Jan | Feb | Mar | Apr | May | Jun | Jul | Aug | Sep | Oct | Nov | Dec |
|---|---|---|---|---|---|---|---|---|---|---|---|---|
| 2010 | 12,235 | 13,173 | 15,052 | 18,533 | 21,050 | 20,385 | 18,976 | 16,565 | 14,551 | 14,385 | 16,395 | 16,701 |
| 2011 | 14,556 | 14,029 | 12,854 | 13,603 | 14,012 | 13,705 | 13,614 | 13,126 | 11,804 | 13,366 | 13,709 | 13,111 |
| 2012 | 14,832 | 17,905 | 21,725 | 24,064 | 27,176 | 26,581 | 24,664 | 24,684 | 26,257 | 27,885 | 29,297 | 27,991 |
| 2013 | 26,766 | 25,755 | 26,185 | 27,291 | 27,224 | 27,608 | 26,351 | 26,674 | 25,578 | 24,612 | 22,516 | 19,795 |
| 2014 | 19,432 | 17,600 | 18,545 | 21,938 | 25,523 | 29,217 | 31,472 | 28,810 | 28,344 | 28,355 | 26,122 | 24,667 |
| 2015 | 21,346 | 18,851 | 19,792 | 21,564 | 20,533 | 19,906 | 18,620 | 20,652 | 20,514 | 21,314 | 22,595 | 22,734 |
| 2016 | 22,754 | 22,287 | 23,528 | 25,373 | 31,686 | 38,138 | 40,817 | 38,933 | 38,528 | 40,015 | 42,649 | 41,487 |
| 2017 | 39,388 | 40,315 | 41,711 | 43,240 | 42,446 | 42,529 | 40,969 | 42,188 | 43,646 | 48,329 | 47,994 | 44,901 |
| 2018 | 40,474 | 43,043 | 40,266 | 37,234 | 38,177 | 36,489 | 36,072 | 35,260 | 37,304 | 40,080 | 40,492 | 39,756 |
| 2019 | 36,995 | 36,557 | 39,989 | 41,343 | 45,155 | 49,420 | 46,572 | 44,109 | 46,147 | 48,177 | 47,636 | 45,787 |
| 2020 | 43,390 | 40,547 | 40,852 | 38,794 | 35,896 | 38,805 | 40,647 | 47,225 | 59,306 | 64,636 | 63,759 | 56,915 |
| 2021 | 53,779 | 55,419 | 59,929 | 60,002 | 58,102 | 55,597 | 56,966 | 53,676 | 54,745 | 54,024 | 54,977 | 48,975 |
| 2022 | 39,662 | 34,945 | 34,239 | 36,465 | 38,866 | 35,027 | 32,707 | 35,754 | 38,565 | 38,624 | 42,252 | 39,283 |
| 2023 | 38,461 | 37,660 | 39,086 | 41,965 | 39,485 | 37,526 | 34,603 | 36,816 | 42,271 | 51,424 | 57,694 | 52,328 |
| 2024 | 44,180 | |||||||||||
| - = No Data Reported; -- = Not Applicable; NA = Not Available; W = Withheld to avoid disclosure of individual company data. |
| Release Date: 3/29/2024 |
| Next Release Date: 4/30/2024 |