|
Download Data (XLS File) |
|
||||||||
|
||||||||
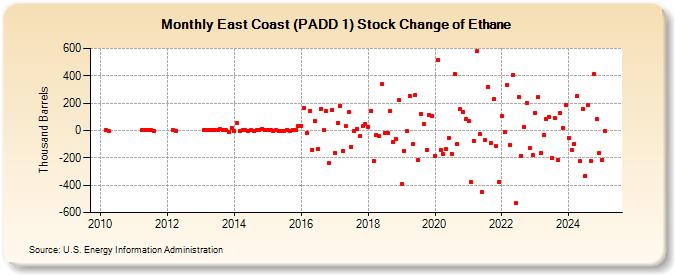
| East Coast (PADD 1) Stock Change of Ethane (Thousand Barrels) | ||||||||
| Year | Jan | Feb | Mar | Apr | May | Jun | Jul | Aug | Sep | Oct | Nov | Dec |
|---|---|---|---|---|---|---|---|---|---|---|---|---|
| 2010 | 5 | -5 | ||||||||||
| 2011 | 1 | 0 | 0 | 0 | -1 | |||||||
| 2012 | 1 | -1 | ||||||||||
| 2013 | 1 | 0 | 0 | 0 | 1 | 0 | 8 | 7 | 0 | -9 | 19 | |
| 2014 | -3 | 52 | -1 | 0 | 0 | -1 | 1 | -1 | 0 | 0 | 13 | 1 |
| 2015 | 1 | 0 | -2 | 2 | -1 | -2 | -1 | 2 | -1 | 0 | 1 | 31 |
| 2016 | 35 | 164 | -21 | 144 | -140 | 66 | -137 | 159 | 0 | 142 | -240 | 150 |
| 2017 | -161 | 57 | 178 | -150 | 30 | 132 | -118 | -1 | 9 | -43 | 35 | 46 |
| 2018 | 28 | 140 | -224 | -31 | -43 | 337 | -16 | -22 | 144 | -84 | -60 | 220 |
| 2019 | -393 | -147 | -4 | 251 | -102 | 261 | -216 | 122 | 48 | -143 | 112 | 107 |
| 2020 | -183 | 517 | -144 | -174 | -139 | -54 | -171 | 412 | -98 | 154 | 136 | 81 |
| 2021 | 67 | -380 | -75 | 579 | -26 | -449 | -73 | 318 | -91 | 229 | -117 | -374 |
| 2022 | 104 | -8 | 332 | -106 | 406 | -533 | 247 | -184 | 25 | 202 | -131 | -178 |
| 2023 | 131 | 244 | -347 | 146 | 83 | 102 | -187 | 77 | -214 | 127 | 18 | 186 |
| 2024 | -52 | |||||||||||
| - = No Data Reported; -- = Not Applicable; NA = Not Available; W = Withheld to avoid disclosure of individual company data. |
| Release Date: 3/29/2024 |
| Next Release Date: 4/30/2024 |
Referring Pages: