|
Download Data (XLS File) |
|
||||||||
|
||||||||
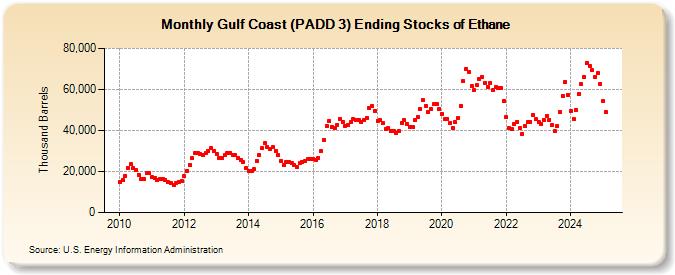
| Gulf Coast (PADD 3) Ending Stocks of Ethane (Thousand Barrels) | ||||||||
| Year | Jan | Feb | Mar | Apr | May | Jun | Jul | Aug | Sep | Oct | Nov | Dec |
|---|---|---|---|---|---|---|---|---|---|---|---|---|
| 2010 | 15,023 | 15,965 | 17,990 | 21,930 | 23,529 | 21,489 | 20,545 | 18,345 | 16,157 | 16,453 | 19,332 | 19,110 |
| 2011 | 17,307 | 16,759 | 15,696 | 16,118 | 16,494 | 15,981 | 15,004 | 14,283 | 13,267 | 14,516 | 15,021 | 15,358 |
| 2012 | 17,649 | 20,483 | 23,333 | 26,414 | 29,198 | 29,255 | 28,436 | 28,097 | 28,874 | 29,844 | 31,322 | 29,885 |
| 2013 | 28,504 | 26,708 | 26,734 | 27,950 | 29,085 | 29,046 | 28,104 | 27,876 | 26,674 | 25,704 | 24,617 | 21,561 |
| 2014 | 20,444 | 20,443 | 21,038 | 25,358 | 28,116 | 31,453 | 33,657 | 31,859 | 31,183 | 31,786 | 30,175 | 28,035 |
| 2015 | 25,185 | 23,125 | 24,570 | 24,591 | 24,053 | 23,122 | 22,386 | 23,996 | 24,548 | 25,130 | 25,937 | 26,034 |
| 2016 | 26,128 | 25,770 | 26,660 | 29,784 | 35,448 | 42,241 | 44,727 | 41,791 | 41,178 | 42,874 | 45,577 | 44,134 |
| 2017 | 42,399 | 42,649 | 44,004 | 45,417 | 45,020 | 44,997 | 43,983 | 45,028 | 46,240 | 51,088 | 52,043 | 49,661 |
| 2018 | 44,761 | 45,060 | 43,647 | 40,673 | 41,119 | 39,568 | 39,514 | 38,581 | 39,603 | 43,825 | 44,998 | 43,323 |
| 2019 | 41,621 | 41,586 | 45,021 | 46,677 | 50,583 | 54,709 | 52,108 | 49,131 | 50,238 | 52,760 | 52,882 | 50,576 |
| 2020 | 48,154 | 45,494 | 45,635 | 43,568 | 41,264 | 43,952 | 46,089 | 52,020 | 64,080 | 70,122 | 68,621 | 61,739 |
| 2021 | 59,510 | 62,138 | 65,314 | 66,147 | 63,277 | 61,124 | 63,086 | 59,580 | 61,179 | 60,513 | 60,710 | 54,288 |
| 2022 | 46,427 | 41,006 | 40,615 | 43,009 | 44,286 | 41,076 | 38,505 | 42,080 | 44,096 | 44,139 | 47,696 | 45,455 |
| 2023 | 43,990 | 43,309 | 45,297 | 47,308 | 45,323 | 42,860 | 39,576 | 42,098 | 49,625 | 56,975 | 63,851 | 57,488 |
| 2024 | 49,472 | 45,385 | 50,142 | 57,554 | ||||||||
| - = No Data Reported; -- = Not Applicable; NA = Not Available; W = Withheld to avoid disclosure of individual company data. |
| Release Date: 6/28/2024 |
| Next Release Date: 7/31/2024 |