|
Download Data (XLS File) |
|
||||||||
|
||||||||
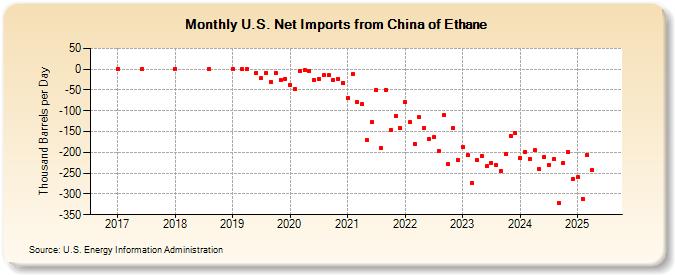
| U.S. Net Imports from China of Ethane (Thousand Barrels per Day) | ||||||||
| Year | Jan | Feb | Mar | Apr | May | Jun | Jul | Aug | Sep | Oct | Nov | Dec |
|---|---|---|---|---|---|---|---|---|---|---|---|---|
| 2017 | 0 | 0 | ||||||||||
| 2018 | 0 | 0 | ||||||||||
| 2019 | 0 | 0 | 0 | -9 | -22 | -9 | -31 | -9 | -26 | -23 | ||
| 2020 | -37 | -48 | -4 | -3 | -4 | -26 | -23 | -15 | -14 | -25 | -23 | -33 |
| 2021 | -69 | -12 | -80 | -84 | -171 | -128 | -51 | -190 | -50 | -146 | -113 | -142 |
| 2022 | -80 | -128 | -179 | -116 | -142 | -167 | -164 | -196 | -110 | -229 | -142 | -218 |
| 2023 | -188 | -217 | -274 | -219 | -208 | -234 | -207 | -229 | -244 | -205 | -161 | -154 |
| 2024 | -214 | -199 | -215 | -195 | ||||||||
| - = No Data Reported; -- = Not Applicable; NA = Not Available; W = Withheld to avoid disclosure of individual company data. |
| Release Date: 6/28/2024 |
| Next Release Date: 7/31/2024 |