|
Download Data (XLS File) |
|
||||||||
|
||||||||
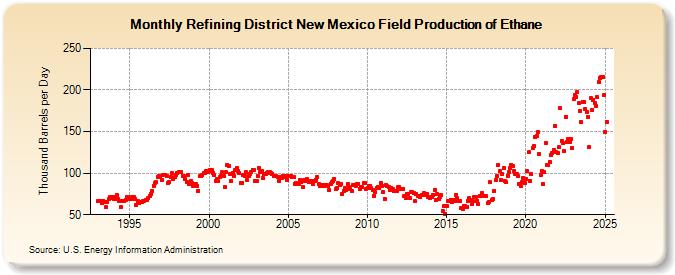
| Refining District New Mexico Field Production of Ethane (Thousand Barrels per Day) | ||||||||
| Year | Jan | Feb | Mar | Apr | May | Jun | Jul | Aug | Sep | Oct | Nov | Dec |
|---|---|---|---|---|---|---|---|---|---|---|---|---|
| 1993 | 66 | 67 | 67 | 64 | 67 | 65 | 59 | 65 | 69 | 71 | 70 | 71 |
| 1994 | 69 | 71 | 74 | 69 | 67 | 59 | 66 | 66 | 67 | 68 | 71 | 71 |
| 1995 | 69 | 69 | 71 | 71 | 69 | 62 | 66 | 64 | 65 | 65 | 67 | 67 |
| 1996 | 68 | 68 | 70 | 73 | 75 | 79 | 85 | 88 | 89 | 95 | 97 | 95 |
| 1997 | 92 | 98 | 98 | 98 | 97 | 88 | 89 | 95 | 100 | 93 | 95 | 98 |
| 1998 | 100 | 101 | 101 | 101 | 97 | 97 | 93 | 89 | 98 | 87 | 91 | 88 |
| 1999 | 84 | 87 | 87 | 85 | 79 | 96 | 97 | 98 | 100 | 100 | 103 | 101 |
| 2000 | 102 | 104 | 104 | 100 | 98 | 91 | 93 | 90 | 95 | 97 | 101 | 96 |
| 2001 | 83 | 101 | 110 | 108 | 99 | 91 | 100 | 97 | 104 | 106 | 102 | 100 |
| 2002 | 88 | 88 | 98 | 96 | 101 | 92 | 97 | 99 | 101 | 104 | 104 | 91 |
| 2003 | 90 | 97 | 106 | 101 | 103 | 94 | 99 | 99 | 100 | 101 | 101 | 100 |
| 2004 | 99 | 97 | 96 | 96 | 95 | 90 | 95 | 94 | 96 | 95 | 96 | 92 |
| 2005 | 96 | 97 | 97 | 95 | 95 | 87 | 88 | 87 | 87 | 92 | 89 | 83 |
| 2006 | 92 | 90 | 93 | 91 | 89 | 90 | 91 | 87 | 90 | 92 | 95 | 87 |
| 2007 | 85 | 86 | 86 | 84 | 86 | 86 | 85 | 80 | 87 | 89 | 90 | 93 |
| 2008 | 81 | 82 | 88 | 86 | 87 | 75 | 79 | 82 | 80 | 87 | 83 | 81 |
| 2009 | 79 | 86 | 86 | 84 | 87 | 87 | 81 | 83 | 83 | 88 | 88 | 81 |
| 2010 | 82 | 85 | 85 | 82 | 80 | 73 | 77 | 82 | 83 | 82 | 88 | 85 |
| 2011 | 77 | 69 | 86 | 84 | 83 | 80 | 82 | 81 | 79 | 79 | 78 | 83 |
| 2012 | 83 | 81 | 81 | 81 | 73 | 70 | 75 | 75 | 70 | 77 | 77 | 76 |
| 2013 | 66 | 75 | 72 | 72 | 71 | 74 | 74 | 76 | 74 | 75 | 71 | 70 |
| 2014 | 71 | 71 | 74 | 80 | 68 | 75 | 69 | 71 | 74 | 55 | 60 | 51 |
| 2015 | 61 | 66 | 66 | 68 | 65 | 68 | 67 | 74 | 70 | 66 | 67 | 58 |
| 2016 | 57 | 61 | 60 | 59 | 67 | 70 | 68 | 63 | 66 | 71 | 71 | 67 |
| 2017 | 63 | 72 | 73 | 76 | 72 | 72 | 72 | 64 | 65 | 89 | 68 | 69 |
| 2018 | 79 | 92 | 97 | 110 | 102 | 92 | 99 | 106 | 91 | 89 | 97 | 101 |
| 2019 | 106 | 110 | 108 | 103 | 99 | 99 | 96 | 87 | 84 | 89 | 94 | 88 |
| 2020 | 93 | 102 | 125 | 91 | 99 | 130 | 133 | 144 | 145 | 149 | 123 | 98 |
| 2021 | 103 | 87 | 101 | 136 | 110 | 110 | 113 | 122 | 124 | 128 | 157 | 125 |
| 2022 | 124 | 131 | 178 | 139 | 136 | 127 | 168 | 137 | 141 | 138 | 141 | 130 |
| 2023 | 189 | 194 | 191 | 195 | 182 | 173 | 162 | 167 | 185 | 176 | 173 | 165 |
| 2024 | 132 | 190 | 176 | 188 | ||||||||
| - = No Data Reported; -- = Not Applicable; NA = Not Available; W = Withheld to avoid disclosure of individual company data. |
| Release Date: 6/28/2024 |
| Next Release Date: 7/31/2024 |