|
Download Data (XLS File) |
|
||||||||
|
||||||||
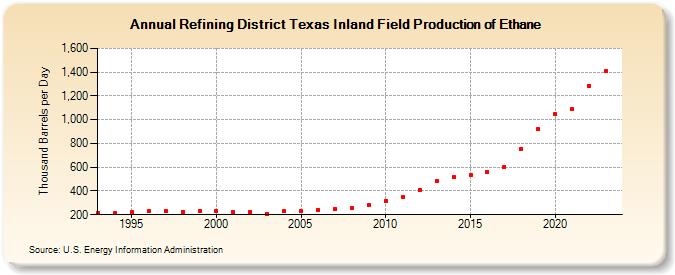
| Refining District Texas Inland Field Production of Ethane (Thousand Barrels per Day) | ||||||||
| Decade | Year-0 | Year-1 | Year-2 | Year-3 | Year-4 | Year-5 | Year-6 | Year-7 | Year-8 | Year-9 |
|---|---|---|---|---|---|---|---|---|---|---|
| 1990's | 213 | 216 | 219 | 229 | 228 | 227 | 229 | |||
| 2000's | 232 | 219 | 225 | 204 | 229 | 229 | 241 | 252 | 255 | 278 |
| 2010's | 315 | 346 | 410 | 483 | 519 | 533 | 562 | 605 | 757 | 918 |
| 2020's | 1,046 | 1,086 | 1,285 | 1,407 |
| - = No Data Reported; -- = Not Applicable; NA = Not Available; W = Withheld to avoid disclosure of individual company data. |
| Release Date: 3/29/2024 |
| Next Release Date: 8/30/2024 |