|
Download Data (XLS File) |
|
||||||||
|
||||||||
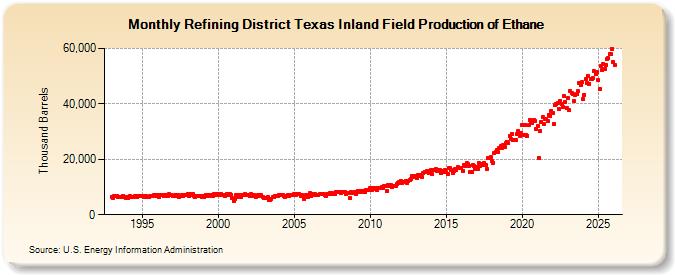
| Refining District Texas Inland Field Production of Ethane (Thousand Barrels) | ||||||||
| Year | Jan | Feb | Mar | Apr | May | Jun | Jul | Aug | Sep | Oct | Nov | Dec |
|---|---|---|---|---|---|---|---|---|---|---|---|---|
| 1993 | 6,523 | 6,135 | 6,719 | 6,599 | 6,779 | 6,389 | 6,536 | 6,434 | 6,334 | 6,888 | 6,301 | 6,126 |
| 1994 | 6,505 | 5,946 | 6,715 | 6,476 | 6,520 | 6,429 | 6,596 | 6,643 | 6,557 | 6,714 | 6,658 | 6,926 |
| 1995 | 6,807 | 6,257 | 6,755 | 6,590 | 6,563 | 6,328 | 6,571 | 6,575 | 6,634 | 7,021 | 6,948 | 6,804 |
| 1996 | 7,143 | 6,457 | 7,208 | 6,991 | 6,963 | 6,624 | 6,973 | 7,225 | 6,904 | 7,299 | 7,071 | 7,078 |
| 1997 | 6,900 | 6,574 | 7,178 | 6,835 | 6,971 | 6,479 | 6,929 | 7,018 | 6,844 | 7,122 | 6,975 | 7,242 |
| 1998 | 7,514 | 6,852 | 7,415 | 7,267 | 7,337 | 6,714 | 6,367 | 6,664 | 6,689 | 6,855 | 6,851 | 6,504 |
| 1999 | 6,820 | 6,485 | 7,076 | 6,878 | 6,903 | 6,956 | 7,084 | 6,755 | 6,893 | 7,322 | 7,111 | 7,439 |
| 2000 | 7,375 | 6,984 | 7,423 | 7,113 | 7,009 | 6,892 | 7,280 | 7,321 | 7,071 | 7,354 | 7,114 | 5,940 |
| 2001 | 5,042 | 5,767 | 7,061 | 6,210 | 7,039 | 6,643 | 6,520 | 6,948 | 7,035 | 7,454 | 7,137 | 7,209 |
| 2002 | 6,965 | 6,631 | 7,325 | 6,840 | 6,966 | 6,613 | 6,485 | 6,947 | 6,824 | 6,937 | 6,970 | 6,465 |
| 2003 | 6,193 | 6,054 | 6,207 | 6,427 | 5,415 | 5,400 | 5,812 | 6,219 | 6,309 | 6,782 | 6,852 | 6,741 |
| 2004 | 7,236 | 6,969 | 7,217 | 6,934 | 6,870 | 6,516 | 6,900 | 6,972 | 6,793 | 7,246 | 7,024 | 7,204 |
| 2005 | 7,392 | 6,977 | 7,638 | 7,344 | 7,297 | 6,663 | 7,057 | 6,837 | 5,737 | 7,102 | 7,137 | 6,562 |
| 2006 | 7,666 | 6,891 | 7,544 | 7,253 | 7,297 | 7,046 | 7,117 | 7,049 | 7,352 | 7,540 | 7,382 | 7,652 |
| 2007 | 7,287 | 6,831 | 7,568 | 7,341 | 7,718 | 7,443 | 7,771 | 7,548 | 7,613 | 8,273 | 8,083 | 8,329 |
| 2008 | 8,125 | 7,718 | 8,229 | 8,244 | 8,189 | 7,569 | 7,690 | 7,700 | 6,106 | 8,118 | 7,867 | 7,777 |
| 2009 | 8,352 | 7,418 | 8,566 | 8,315 | 8,734 | 8,266 | 8,375 | 8,410 | 8,350 | 8,945 | 8,903 | 8,863 |
| 2010 | 9,542 | 8,769 | 9,800 | 9,310 | 9,674 | 9,014 | 9,596 | 9,582 | 9,671 | 9,982 | 9,817 | 10,317 |
| 2011 | 10,443 | 8,506 | 10,707 | 10,221 | 10,775 | 10,025 | 10,446 | 10,185 | 10,249 | 11,237 | 11,384 | 11,962 |
| 2012 | 12,138 | 11,414 | 11,953 | 11,753 | 12,094 | 11,425 | 12,182 | 12,395 | 12,936 | 13,973 | 14,005 | 13,614 |
| 2013 | 13,981 | 13,384 | 14,358 | 14,051 | 14,445 | 13,629 | 15,221 | 15,567 | 15,358 | 15,928 | 14,889 | 15,525 |
| 2014 | 16,078 | 14,571 | 16,100 | 16,100 | 16,391 | 15,919 | 16,171 | 15,985 | 14,996 | 15,669 | 15,245 | 16,075 |
| 2015 | 15,369 | 14,735 | 16,848 | 16,728 | 16,208 | 15,223 | 15,705 | 16,506 | 16,217 | 17,112 | 16,808 | 16,998 |
| 2016 | 16,842 | 15,918 | 17,955 | 17,400 | 18,652 | 18,177 | 17,738 | 15,336 | 15,426 | 18,025 | 17,419 | 16,654 |
| 2017 | 17,180 | 16,588 | 18,581 | 17,528 | 18,415 | 18,008 | 18,591 | 18,075 | 16,408 | 20,434 | 20,363 | 20,672 |
| 2018 | 19,305 | 18,814 | 22,098 | 22,576 | 23,336 | 22,460 | 23,989 | 24,624 | 23,931 | 25,128 | 24,379 | 25,754 |
| 2019 | 26,410 | 25,772 | 28,358 | 27,458 | 29,031 | 26,912 | 26,865 | 26,932 | 29,088 | 30,114 | 28,568 | 29,619 |
| 2020 | 32,253 | 28,576 | 32,465 | 28,756 | 28,445 | 32,239 | 34,291 | 33,392 | 33,253 | 34,328 | 33,821 | 31,026 |
| 2021 | 32,050 | 20,625 | 30,191 | 33,582 | 35,104 | 32,663 | 34,668 | 34,629 | 33,938 | 36,014 | 35,617 | 37,473 |
| 2022 | 36,731 | 32,798 | 39,580 | 39,793 | 40,221 | 38,225 | 41,025 | 40,011 | 39,029 | 42,756 | 40,493 | 38,537 |
| 2023 | 39,459 | 35,856 | 42,817 | 42,871 | 43,100 | 40,350 | 42,725 | 42,916 | 43,829 | 46,894 | 46,333 | 46,530 |
| 2024 | 41,729 | |||||||||||
| - = No Data Reported; -- = Not Applicable; NA = Not Available; W = Withheld to avoid disclosure of individual company data. |
| Release Date: 3/29/2024 |
| Next Release Date: 4/30/2024 |