|
Download Data (XLS File) |
|
||||||||
|
||||||||
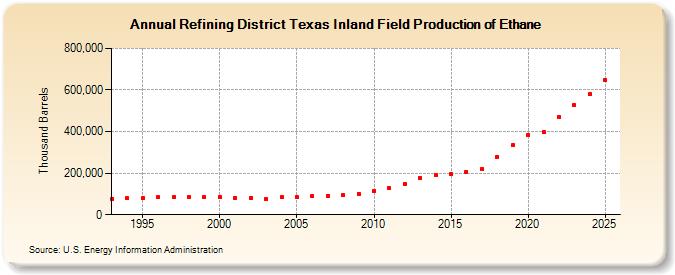
| Refining District Texas Inland Field Production of Ethane (Thousand Barrels) | ||||||||
| Decade | Year-0 | Year-1 | Year-2 | Year-3 | Year-4 | Year-5 | Year-6 | Year-7 | Year-8 | Year-9 |
|---|---|---|---|---|---|---|---|---|---|---|
| 1990's | 77,763 | 78,685 | 79,853 | 83,936 | 83,067 | 83,029 | 83,722 | |||
| 2000's | 84,876 | 80,065 | 81,968 | 74,411 | 83,881 | 83,743 | 87,789 | 91,805 | 93,332 | 101,497 |
| 2010's | 115,074 | 126,140 | 149,882 | 176,336 | 189,300 | 194,457 | 205,542 | 220,843 | 276,394 | 335,127 |
| 2020's | 382,845 | 396,554 | 469,199 | 513,680 |
| - = No Data Reported; -- = Not Applicable; NA = Not Available; W = Withheld to avoid disclosure of individual company data. |
| Release Date: 3/29/2024 |
| Next Release Date: 8/30/2024 |