|
Download Data (XLS File) |
|
||||||||
|
||||||||
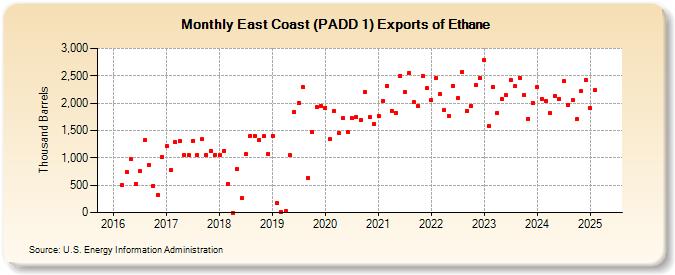
| East Coast (PADD 1) Exports of Ethane (Thousand Barrels) | ||||||||
| Year | Jan | Feb | Mar | Apr | May | Jun | Jul | Aug | Sep | Oct | Nov | Dec |
|---|---|---|---|---|---|---|---|---|---|---|---|---|
| 2016 | 497 | 736 | 974 | 522 | 751 | 1,319 | 870 | 490 | 321 | 1,013 | ||
| 2017 | 1,209 | 782 | 1,287 | 1,299 | 1,050 | 1,050 | 1,312 | 1,050 | 1,336 | 1,050 | 1,129 | 1,050 |
| 2018 | 1,050 | 1,134 | 529 | 0 | 793 | 265 | 1,064 | 1,406 | 1,405 | 1,329 | 1,392 | 1,066 |
| 2019 | 1,405 | 167 | 17 | 22 | 1,047 | 1,838 | 2,004 | 2,288 | 637 | 1,463 | 1,920 | 1,954 |
| 2020 | 1,917 | 1,339 | 1,853 | 1,448 | 1,719 | 1,467 | 1,725 | 1,741 | 1,697 | 2,208 | 1,740 | 1,612 |
| 2021 | 1,765 | 2,044 | 2,314 | 1,865 | 1,826 | 2,499 | 2,209 | 2,557 | 2,017 | 1,954 | 2,498 | 2,271 |
| 2022 | 2,049 | 2,460 | 2,161 | 1,867 | 1,769 | 2,319 | 2,087 | 2,576 | 1,855 | 1,954 | 2,326 | 2,450 |
| 2023 | 2,975 | 1,775 | 2,444 | 1,628 | 1,965 | 2,187 | 2,424 | 2,310 | 2,472 | 2,144 | 1,713 | 1,827 |
| 2024 | 2,294 | |||||||||||
| - = No Data Reported; -- = Not Applicable; NA = Not Available; W = Withheld to avoid disclosure of individual company data. |
| Release Date: 3/29/2024 |
| Next Release Date: 4/30/2024 |