|
Download Data (XLS File) |
|
||||||||
|
||||||||
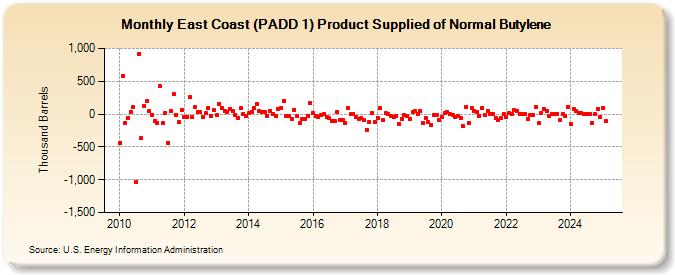
| East Coast (PADD 1) Product Supplied of Normal Butylene (Thousand Barrels) | ||||||||
| Year | Jan | Feb | Mar | Apr | May | Jun | Jul | Aug | Sep | Oct | Nov | Dec |
|---|---|---|---|---|---|---|---|---|---|---|---|---|
| 2010 | -436 | 579 | -129 | -56 | 37 | 103 | -1,032 | 916 | -369 | 128 | 197 | 42 |
| 2011 | -7 | -103 | -133 | 424 | -139 | 19 | -436 | 40 | 300 | -10 | -125 | 62 |
| 2012 | -46 | -42 | 258 | -49 | 111 | 24 | 31 | -47 | 10 | 95 | -29 | 55 |
| 2013 | -17 | 155 | 95 | 43 | 32 | 77 | 50 | -16 | -54 | 87 | 7 | -32 |
| 2014 | 14 | 33 | 92 | 146 | 39 | 35 | 36 | -23 | 50 | 2 | -29 | 81 |
| 2015 | 93 | 206 | -24 | -35 | -75 | 66 | -37 | -137 | -75 | -79 | -33 | 164 |
| 2016 | 17 | -23 | -45 | -17 | 0 | -45 | -65 | -101 | -102 | 27 | -90 | -88 |
| 2017 | -138 | 87 | -4 | -2 | -52 | -71 | -65 | -91 | -237 | -123 | 18 | -119 |
| 2018 | -54 | 93 | -92 | 12 | -3 | -34 | -50 | -27 | -154 | -68 | -18 | -26 |
| 2019 | -68 | 31 | 42 | -2 | 42 | -131 | -54 | -124 | -170 | -19 | -11 | -88 |
| 2020 | -52 | 11 | 30 | -2 | -7 | -39 | -22 | -61 | -188 | 109 | -138 | 90 |
| 2021 | 39 | 29 | -31 | 90 | -19 | 43 | -6 | 3 | -53 | -86 | -58 | 0 |
| 2022 | -42 | 18 | 4 | 56 | 48 | 1 | -2 | -3 | -75 | -9 | -21 | 109 |
| 2023 | -143 | 19 | 80 | 42 | -36 | 5 | -2 | 1 | -96 | 3 | -23 | 103 |
| 2024 | -148 | |||||||||||
| - = No Data Reported; -- = Not Applicable; NA = Not Available; W = Withheld to avoid disclosure of individual company data. |
| Release Date: 3/29/2024 |
| Next Release Date: 4/30/2024 |