|
Download Data (XLS File) |
|
||||||||
|
||||||||
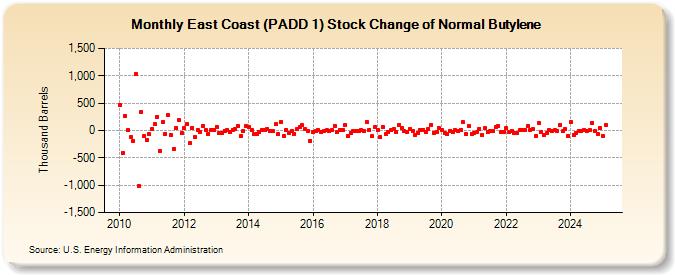
| East Coast (PADD 1) Stock Change of Normal Butylene (Thousand Barrels) | ||||||||
| Year | Jan | Feb | Mar | Apr | May | Jun | Jul | Aug | Sep | Oct | Nov | Dec |
|---|---|---|---|---|---|---|---|---|---|---|---|---|
| 2010 | 468 | -413 | 267 | 2 | -123 | -187 | 1,034 | -1,006 | 343 | -110 | -169 | -68 |
| 2011 | 33 | 113 | 254 | -380 | 147 | -57 | 276 | -84 | -334 | 42 | 186 | -47 |
| 2012 | 43 | 119 | -237 | 49 | -120 | 9 | -19 | 84 | 7 | -57 | 9 | 4 |
| 2013 | 69 | -46 | -38 | -5 | 1 | -25 | 10 | 23 | 86 | -103 | -6 | 75 |
| 2014 | 56 | 14 | -69 | -58 | -34 | 10 | 14 | 28 | -16 | -18 | 111 | -64 |
| 2015 | 154 | -96 | 10 | -44 | -9 | -56 | 31 | 69 | 96 | 22 | -7 | -189 |
| 2016 | -24 | -12 | 2 | -31 | -18 | 4 | -2 | 5 | 90 | -29 | 17 | 2 |
| 2017 | 91 | -110 | -41 | -16 | -5 | -3 | 7 | -12 | 159 | 14 | -100 | 64 |
| 2018 | 7 | -123 | 68 | -60 | -29 | 2 | 19 | -23 | 98 | 39 | -16 | -23 |
| 2019 | 23 | -4 | -78 | -39 | 15 | 17 | -24 | 36 | 107 | -39 | -19 | 40 |
| 2020 | 15 | -48 | -66 | -4 | -29 | 6 | -2 | 15 | 147 | -69 | 86 | -57 |
| 2021 | -43 | -34 | 33 | -88 | 40 | -35 | -4 | -3 | 62 | 78 | -21 | -37 |
| 2022 | 44 | -21 | -3 | -54 | -49 | 0 | 0 | 2 | 74 | 10 | 22 | -109 |
| 2023 | 144 | -20 | -82 | -42 | 8 | -7 | 0 | -1 | 97 | -16 | 22 | -103 |
| 2024 | 150 | |||||||||||
| - = No Data Reported; -- = Not Applicable; NA = Not Available; W = Withheld to avoid disclosure of individual company data. |
| Release Date: 3/29/2024 |
| Next Release Date: 4/30/2024 |