|
Download Data (XLS File) |
|
||||||||
|
||||||||
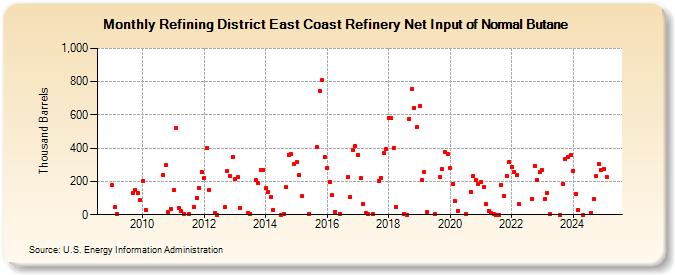
| Refining District East Coast Refinery Net Input of Normal Butane (Thousand Barrels) | ||||||||
| Year | Jan | Feb | Mar | Apr | May | Jun | Jul | Aug | Sep | Oct | Nov | Dec |
|---|---|---|---|---|---|---|---|---|---|---|---|---|
| 2009 | 178 | 44 | 5 | 132 | 151 | 128 | 89 | |||||
| 2010 | 200 | 31 | 239 | 297 | 19 | 36 | ||||||
| 2011 | 148 | 523 | 40 | 22 | 7 | 5 | 47 | 99 | 163 | 256 | ||
| 2012 | 222 | 400 | 148 | 10 | 1 | 46 | 265 | 234 | 348 | |||
| 2013 | 212 | 224 | 43 | 10 | 6 | 210 | 188 | 268 | 271 | |||
| 2014 | 158 | 135 | 107 | 30 | 1 | 2 | 164 | 361 | 363 | 304 | ||
| 2015 | 318 | 238 | 110 | 6 | 408 | 744 | 808 | 349 | ||||
| 2016 | 283 | 198 | 116 | 18 | 5 | 225 | 105 | 388 | 411 | |||
| 2017 | 362 | 219 | 67 | 9 | 3 | 5 | 202 | 222 | 370 | 398 | ||
| 2018 | 582 | 581 | 404 | 48 | 4 | 1 | 578 | 756 | 642 | 527 | ||
| 2019 | 655 | 207 | 257 | 18 | 4 | 227 | 272 | 377 | 367 | |||
| 2020 | 279 | 186 | 82 | 25 | 3 | 139 | 231 | 209 | 184 | |||
| 2021 | 199 | 169 | 63 | 23 | 10 | 5 | 1 | 1 | 181 | 114 | 233 | 318 |
| 2022 | 289 | 259 | 236 | 62 | 96 | 295 | 208 | 257 | ||||
| 2023 | 268 | 94 | 131 | 4 | 1 | 187 | 336 | 349 | 362 | |||
| 2024 | 265 | |||||||||||
| - = No Data Reported; -- = Not Applicable; NA = Not Available; W = Withheld to avoid disclosure of individual company data. |
| Release Date: 3/29/2024 |
| Next Release Date: 4/30/2024 |
Referring Pages: