|
Download Data (XLS File) |
|
||||||||
|
||||||||
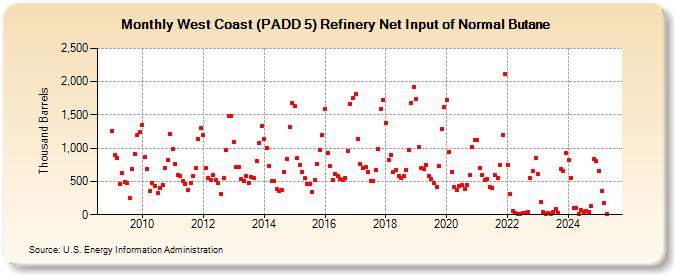
| West Coast (PADD 5) Refinery Net Input of Normal Butane (Thousand Barrels) | ||||||||
| Year | Jan | Feb | Mar | Apr | May | Jun | Jul | Aug | Sep | Oct | Nov | Dec |
|---|---|---|---|---|---|---|---|---|---|---|---|---|
| 2009 | 1,261 | 892 | 852 | 459 | 625 | 486 | 470 | 248 | 688 | 918 | 1,197 | 1,239 |
| 2010 | 1,354 | 875 | 681 | 355 | 473 | 436 | 323 | 403 | 451 | 707 | 825 | 1,216 |
| 2011 | 986 | 756 | 595 | 586 | 505 | 455 | 365 | 479 | 581 | 700 | 1,139 | 1,298 |
| 2012 | 1,191 | 695 | 552 | 518 | 593 | 517 | 476 | 313 | 550 | 969 | 1,487 | 1,485 |
| 2013 | 1,086 | 716 | 711 | 537 | 500 | 586 | 479 | 570 | 555 | 808 | 1,085 | 1,337 |
| 2014 | 1,138 | 997 | 725 | 503 | 502 | 381 | 349 | 374 | 643 | 837 | 1,324 | 1,675 |
| 2015 | 1,630 | 850 | 745 | 638 | 555 | 463 | 465 | 345 | 516 | 762 | 976 | 1,197 |
| 2016 | 1,594 | 933 | 736 | 527 | 612 | 579 | 534 | 521 | 549 | 954 | 1,665 | 1,757 |
| 2017 | 1,809 | 1,141 | 761 | 698 | 716 | 647 | 512 | 509 | 674 | 985 | 1,593 | 1,721 |
| 2018 | 1,381 | 825 | 904 | 640 | 670 | 589 | 557 | 576 | 678 | 974 | 1,686 | 1,926 |
| 2019 | 1,732 | 1,014 | 709 | 691 | 748 | 588 | 534 | 470 | 414 | 730 | 1,292 | 1,617 |
| 2020 | 1,727 | 938 | 637 | 412 | 365 | 436 | 443 | 389 | 450 | 590 | 1,013 | 1,127 |
| 2021 | 1,129 | 699 | 598 | 521 | 536 | 415 | 406 | 600 | 547 | 743 | 1,197 | 2,119 |
| 2022 | 748 | 311 | 55 | 21 | 14 | 9 | 19 | 24 | 39 | 548 | 658 | 855 |
| 2023 | 609 | 188 | 42 | 4 | 28 | 11 | 39 | 87 | 29 | 693 | 658 | 922 |
| 2024 | 824 | 549 | 106 | 107 | 13 | 71 | 47 | 61 | 37 | 126 | 839 | 800 |
| 2025 | 661 | 362 | 171 | 4 | ||||||||
| - = No Data Reported; -- = Not Applicable; NA = Not Available; W = Withheld to avoid disclosure of individual company data. |
| Release Date: 6/30/2025 |
| Next Release Date: 7/31/2025 |
Referring Pages: