|
Download Data (XLS File) |
|
||||||||
|
||||||||
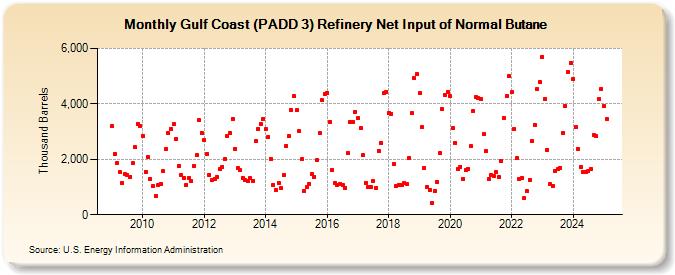
| Gulf Coast (PADD 3) Refinery Net Input of Normal Butane (Thousand Barrels) | ||||||||
| Year | Jan | Feb | Mar | Apr | May | Jun | Jul | Aug | Sep | Oct | Nov | Dec |
|---|---|---|---|---|---|---|---|---|---|---|---|---|
| 2009 | 3,200 | 2,200 | 1,882 | 1,531 | 1,148 | 1,459 | 1,427 | 1,373 | 1,852 | 2,429 | 3,280 | 3,207 |
| 2010 | 2,850 | 1,553 | 2,083 | 1,294 | 1,027 | 678 | 1,070 | 1,123 | 1,561 | 2,367 | 2,937 | 3,095 |
| 2011 | 3,258 | 2,729 | 1,763 | 1,418 | 1,328 | 1,082 | 1,324 | 1,203 | 1,759 | 2,143 | 3,400 | 2,948 |
| 2012 | 2,685 | 2,203 | 1,450 | 1,243 | 1,294 | 1,361 | 1,650 | 1,726 | 2,008 | 2,847 | 2,934 | 3,459 |
| 2013 | 2,380 | 1,678 | 1,608 | 1,341 | 1,239 | 1,231 | 1,322 | 1,229 | 2,644 | 3,104 | 3,279 | 3,463 |
| 2014 | 3,087 | 2,808 | 2,018 | 1,080 | 896 | 1,145 | 948 | 1,437 | 2,496 | 2,831 | 3,777 | 4,265 |
| 2015 | 3,766 | 3,016 | 1,996 | 860 | 983 | 1,126 | 1,467 | 1,368 | 1,963 | 2,964 | 4,123 | 4,372 |
| 2016 | 4,392 | 3,354 | 1,631 | 1,134 | 1,078 | 1,107 | 1,067 | 975 | 2,225 | 3,359 | 3,349 | 3,717 |
| 2017 | 3,471 | 3,137 | 2,139 | 1,158 | 993 | 994 | 1,216 | 980 | 2,308 | 2,586 | 4,386 | 4,439 |
| 2018 | 3,685 | 3,645 | 1,844 | 1,048 | 1,085 | 1,085 | 1,129 | 1,126 | 2,049 | 3,655 | 4,925 | 5,062 |
| 2019 | 4,385 | 3,154 | 1,695 | 1,004 | 906 | 422 | 847 | 1,188 | 2,214 | 3,811 | 4,325 | 4,433 |
| 2020 | 4,268 | 3,134 | 2,592 | 1,665 | 1,731 | 1,289 | 1,604 | 1,666 | 2,465 | 3,732 | 4,252 | 4,206 |
| 2021 | 4,162 | 2,896 | 2,291 | 1,271 | 1,435 | 1,409 | 1,525 | 1,367 | 1,920 | 3,494 | 4,270 | 5,001 |
| 2022 | 4,411 | 3,085 | 2,034 | 1,305 | 1,331 | 603 | 839 | 1,253 | 2,659 | 3,243 | 4,527 | 4,793 |
| 2023 | 5,699 | 4,176 | 2,349 | 1,098 | 1,028 | 1,594 | 1,637 | 1,698 | 2,954 | 3,919 | 5,138 | 5,467 |
| 2024 | 4,904 | |||||||||||
| - = No Data Reported; -- = Not Applicable; NA = Not Available; W = Withheld to avoid disclosure of individual company data. |
| Release Date: 3/29/2024 |
| Next Release Date: 4/30/2024 |
Referring Pages: