|
Download Data (XLS File) |
|
||||||||
|
||||||||
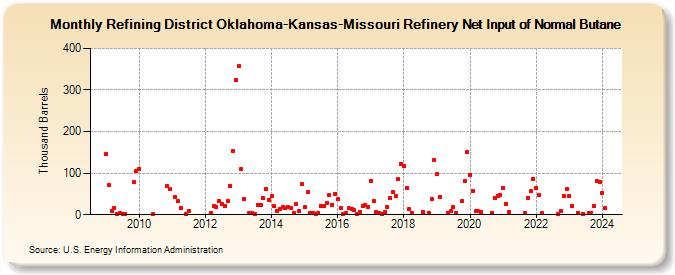
| Refining District Oklahoma-Kansas-Missouri Refinery Net Input of Normal Butane (Thousand Barrels) | ||||||||
| Year | Jan | Feb | Mar | Apr | May | Jun | Jul | Aug | Sep | Oct | Nov | Dec |
|---|---|---|---|---|---|---|---|---|---|---|---|---|
| 2009 | 145 | 71 | 9 | 17 | 1 | 4 | 2 | 2 | 78 | 104 | ||
| 2010 | 111 | 2 | 70 | 62 | ||||||||
| 2011 | 42 | 32 | 17 | 2 | 10 | |||||||
| 2012 | 5 | 20 | 19 | 32 | 25 | 22 | 32 | 70 | 154 | 324 | ||
| 2013 | 357 | 111 | 37 | 4 | 4 | 2 | 24 | 24 | 40 | 61 | 36 | |
| 2014 | 46 | 21 | 9 | 14 | 19 | 15 | 18 | 17 | 3 | 25 | 9 | 73 |
| 2015 | 18 | 54 | 5 | 3 | 1 | 3 | 22 | 21 | 28 | 48 | 24 | 50 |
| 2016 | 37 | 17 | 2 | 4 | 16 | 14 | 11 | 1 | 7 | 21 | 23 | 19 |
| 2017 | 81 | 33 | 6 | 5 | 2 | 6 | 18 | 41 | 54 | 44 | 85 | 121 |
| 2018 | 118 | 64 | 13 | 5 | 6 | 5 | 37 | 132 | ||||
| 2019 | 97 | 42 | 5 | 8 | 19 | 4 | 33 | 81 | 152 | |||
| 2020 | 96 | 58 | 8 | 8 | 7 | 5 | 41 | 46 | 47 | |||
| 2021 | 65 | 25 | 7 | 4 | 41 | 56 | 86 | |||||
| 2022 | 64 | 47 | 3 | 1 | 9 | 46 | 62 | |||||
| 2023 | 45 | 21 | 4 | 1 | 5 | 4 | 22 | 80 | 79 | |||
| 2024 | 52 | 16 | 2 | |||||||||
| - = No Data Reported; -- = Not Applicable; NA = Not Available; W = Withheld to avoid disclosure of individual company data. |
| Release Date: 8/30/2024 |
| Next Release Date: 9/30/2024 |