|
Download Data (XLS File) |
|
||||||||
|
||||||||
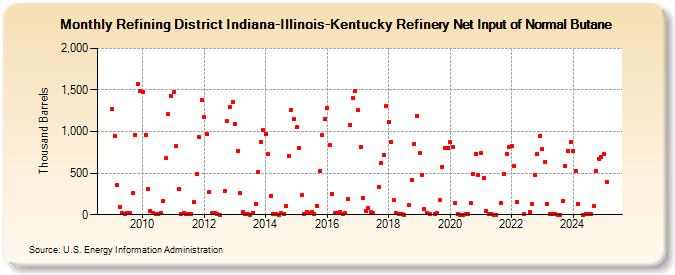
| Refining District Indiana-Illinois-Kentucky Refinery Net Input of Normal Butane (Thousand Barrels) | ||||||||
| Year | Jan | Feb | Mar | Apr | May | Jun | Jul | Aug | Sep | Oct | Nov | Dec |
|---|---|---|---|---|---|---|---|---|---|---|---|---|
| 2009 | 1,270 | 945 | 360 | 87 | 24 | 13 | 15 | 15 | 267 | 961 | 1,573 | 1,489 |
| 2010 | 1,477 | 962 | 315 | 47 | 17 | 7 | 8 | 18 | 169 | 677 | 1,207 | 1,430 |
| 2011 | 1,473 | 825 | 308 | 13 | 19 | 8 | 11 | 9 | 153 | 488 | 934 | 1,376 |
| 2012 | 1,170 | 968 | 277 | 23 | 25 | 6 | 2 | 283 | 1,124 | 1,294 | 1,358 | |
| 2013 | 1,092 | 770 | 265 | 36 | 11 | 4 | 1 | 26 | 133 | 508 | 872 | 1,021 |
| 2014 | 975 | 728 | 224 | 11 | 11 | 1 | 16 | 12 | 109 | 706 | 1,263 | 1,147 |
| 2015 | 1,053 | 801 | 243 | 8 | 33 | 21 | 37 | 3 | 107 | 527 | 953 | 1,150 |
| 2016 | 1,282 | 834 | 246 | 18 | 18 | 35 | 6 | 16 | 193 | 1,082 | 1,409 | 1,492 |
| 2017 | 1,258 | 819 | 203 | 43 | 75 | 31 | 15 | 337 | 619 | 714 | 1,310 | |
| 2018 | 1,118 | 878 | 174 | 18 | 6 | 11 | 1 | 116 | 419 | 854 | 1,183 | |
| 2019 | 745 | 478 | 68 | 25 | 8 | 14 | 15 | 172 | 579 | 806 | 804 | |
| 2020 | 874 | 814 | 144 | 5 | 1 | 1 | 6 | 5 | 139 | 492 | 732 | 483 |
| 2021 | 743 | 443 | 42 | 10 | 12 | 1 | 1 | 139 | 486 | 732 | 816 | |
| 2022 | 822 | 582 | 156 | 7 | 29 | 132 | 481 | 729 | 949 | |||
| 2023 | 786 | 637 | 128 | 12 | 4 | 11 | 1 | 1 | 168 | 584 | 772 | 878 |
| 2024 | 761 | |||||||||||
| - = No Data Reported; -- = Not Applicable; NA = Not Available; W = Withheld to avoid disclosure of individual company data. |
| Release Date: 3/29/2024 |
| Next Release Date: 4/30/2024 |