|
Download Data (XLS File) |
|
||||||||
|
||||||||
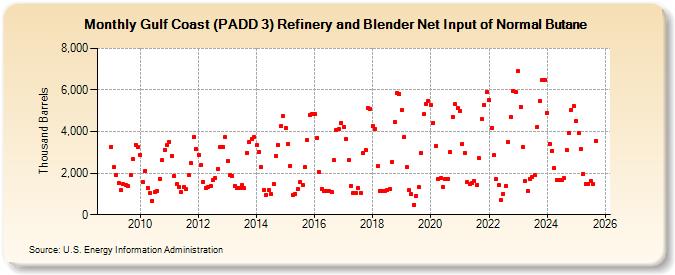
| Gulf Coast (PADD 3) Refinery and Blender Net Input of Normal Butane (Thousand Barrels) | ||||||||
| Year | Jan | Feb | Mar | Apr | May | Jun | Jul | Aug | Sep | Oct | Nov | Dec |
|---|---|---|---|---|---|---|---|---|---|---|---|---|
| 2009 | 3,280 | 2,275 | 1,934 | 1,535 | 1,174 | 1,460 | 1,427 | 1,380 | 1,932 | 2,656 | 3,368 | 3,266 |
| 2010 | 2,891 | 1,569 | 2,120 | 1,305 | 1,039 | 678 | 1,085 | 1,141 | 1,738 | 2,609 | 3,132 | 3,346 |
| 2011 | 3,520 | 2,842 | 1,878 | 1,461 | 1,335 | 1,092 | 1,331 | 1,220 | 1,916 | 2,482 | 3,739 | 3,182 |
| 2012 | 2,890 | 2,383 | 1,581 | 1,285 | 1,343 | 1,393 | 1,678 | 1,761 | 2,210 | 3,268 | 3,252 | 3,731 |
| 2013 | 2,607 | 1,890 | 1,865 | 1,385 | 1,262 | 1,271 | 1,428 | 1,272 | 2,973 | 3,494 | 3,645 | 3,738 |
| 2014 | 3,337 | 3,039 | 2,279 | 1,195 | 967 | 1,193 | 994 | 1,484 | 2,810 | 3,362 | 4,246 | 4,732 |
| 2015 | 4,176 | 3,415 | 2,362 | 959 | 1,018 | 1,220 | 1,565 | 1,453 | 2,286 | 3,596 | 4,815 | 4,866 |
| 2016 | 4,850 | 3,702 | 2,052 | 1,244 | 1,141 | 1,163 | 1,137 | 1,072 | 2,618 | 4,064 | 4,122 | 4,427 |
| 2017 | 4,236 | 3,632 | 2,610 | 1,394 | 1,056 | 1,058 | 1,301 | 1,066 | 2,947 | 3,092 | 5,122 | 5,108 |
| 2018 | 4,283 | 4,130 | 2,349 | 1,159 | 1,120 | 1,130 | 1,179 | 1,234 | 2,559 | 4,463 | 5,868 | 5,811 |
| 2019 | 5,042 | 3,744 | 2,303 | 1,167 | 981 | 488 | 915 | 1,325 | 2,974 | 4,830 | 5,340 | 5,486 |
| 2020 | 5,293 | 4,432 | 3,308 | 1,714 | 1,753 | 1,336 | 1,710 | 1,729 | 3,026 | 4,722 | 5,324 | 5,127 |
| 2021 | 4,991 | 3,416 | 2,983 | 1,554 | 1,493 | 1,504 | 1,610 | 1,453 | 2,704 | 4,598 | 5,296 | 5,881 |
| 2022 | 5,505 | 4,184 | 2,853 | 1,714 | 1,410 | 710 | 1,012 | 1,394 | 3,497 | 4,685 | 5,942 | 5,913 |
| 2023 | 6,892 | 5,193 | 3,270 | 1,613 | 1,144 | 1,725 | 1,818 | 1,893 | 4,241 | 5,443 | 6,455 | 6,437 |
| 2024 | 5,871 | 4,112 | 3,197 | 2,236 | ||||||||
| - = No Data Reported; -- = Not Applicable; NA = Not Available; W = Withheld to avoid disclosure of individual company data. |
| Release Date: 6/28/2024 |
| Next Release Date: 7/31/2024 |