|
Download Data (XLS File) |
|
||||||||
|
||||||||
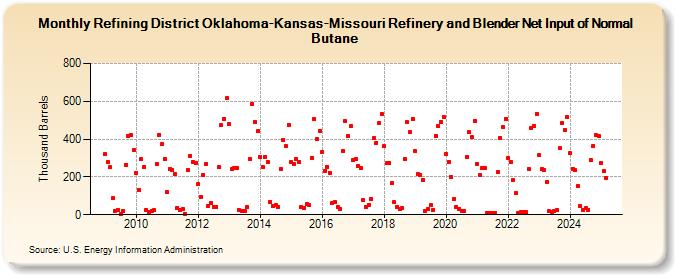
| Refining District Oklahoma-Kansas-Missouri Refinery and Blender Net Input of Normal Butane (Thousand Barrels) | ||||||||
| Year | Jan | Feb | Mar | Apr | May | Jun | Jul | Aug | Sep | Oct | Nov | Dec |
|---|---|---|---|---|---|---|---|---|---|---|---|---|
| 2009 | 319 | 277 | 250 | 88 | 21 | 27 | 3 | 20 | 265 | 417 | 420 | 341 |
| 2010 | 221 | 133 | 293 | 250 | 27 | 17 | 19 | 23 | 270 | 424 | 373 | 294 |
| 2011 | 121 | 241 | 238 | 216 | 37 | 25 | 28 | 4 | 238 | 311 | 279 | 273 |
| 2012 | 163 | 95 | 212 | 270 | 47 | 62 | 40 | 41 | 251 | 472 | 508 | 616 |
| 2013 | 479 | 240 | 245 | 246 | 26 | 19 | 19 | 41 | 294 | 588 | 492 | 441 |
| 2014 | 304 | 252 | 307 | 279 | 68 | 46 | 49 | 41 | 242 | 395 | 362 | 475 |
| 2015 | 279 | 269 | 293 | 279 | 42 | 37 | 56 | 51 | 301 | 506 | 401 | 443 |
| 2016 | 333 | 233 | 253 | 222 | 64 | 67 | 41 | 32 | 336 | 494 | 417 | 470 |
| 2017 | 292 | 295 | 259 | 247 | 76 | 41 | 53 | 82 | 407 | 382 | 487 | 534 |
| 2018 | 362 | 272 | 274 | 169 | 65 | 41 | 30 | 35 | 294 | 489 | 435 | 507 |
| 2019 | 337 | 216 | 212 | 185 | 21 | 30 | 49 | 27 | 417 | 469 | 492 | 519 |
| 2020 | 323 | 279 | 201 | 82 | 43 | 31 | 18 | 18 | 307 | 436 | 409 | 497 |
| 2021 | 267 | 208 | 247 | 249 | 11 | 10 | 9 | 10 | 224 | 406 | 464 | 505 |
| 2022 | 301 | 279 | 184 | 114 | 8 | 14 | 12 | 13 | 242 | 458 | 471 | 535 |
| 2023 | 314 | 241 | 237 | 175 | 18 | 16 | 20 | 25 | 351 | 485 | 447 | 516 |
| 2024 | 324 | |||||||||||
| - = No Data Reported; -- = Not Applicable; NA = Not Available; W = Withheld to avoid disclosure of individual company data. |
| Release Date: 3/29/2024 |
| Next Release Date: 4/30/2024 |