|
Download Data (XLS File) |
|
||||||||
|
||||||||
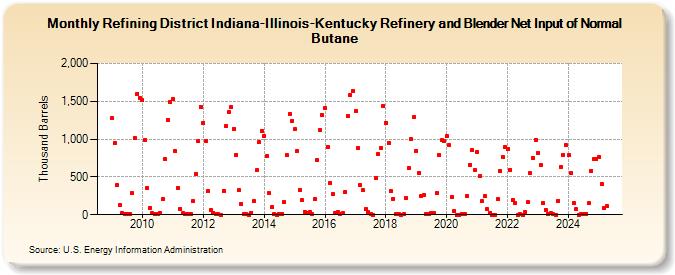
| Refining District Indiana-Illinois-Kentucky Refinery and Blender Net Input of Normal Butane (Thousand Barrels) | ||||||||
| Year | Jan | Feb | Mar | Apr | May | Jun | Jul | Aug | Sep | Oct | Nov | Dec |
|---|---|---|---|---|---|---|---|---|---|---|---|---|
| 2009 | 1,275 | 953 | 388 | 125 | 24 | 13 | 15 | 15 | 290 | 1,016 | 1,603 | 1,542 |
| 2010 | 1,515 | 985 | 355 | 90 | 17 | 7 | 8 | 18 | 204 | 732 | 1,256 | 1,487 |
| 2011 | 1,528 | 842 | 355 | 82 | 21 | 10 | 13 | 10 | 180 | 545 | 970 | 1,428 |
| 2012 | 1,217 | 977 | 308 | 65 | 26 | 7 | 3 | 2 | 316 | 1,173 | 1,358 | 1,423 |
| 2013 | 1,139 | 794 | 322 | 137 | 11 | 5 | 2 | 27 | 178 | 588 | 964 | 1,109 |
| 2014 | 1,044 | 770 | 283 | 97 | 12 | 1 | 16 | 12 | 162 | 784 | 1,330 | 1,245 |
| 2015 | 1,128 | 839 | 327 | 191 | 36 | 21 | 40 | 6 | 202 | 717 | 1,122 | 1,319 |
| 2016 | 1,408 | 897 | 424 | 270 | 19 | 35 | 7 | 18 | 303 | 1,303 | 1,581 | 1,635 |
| 2017 | 1,374 | 879 | 391 | 326 | 75 | 31 | 15 | 2 | 488 | 802 | 888 | 1,438 |
| 2018 | 1,218 | 953 | 313 | 214 | 6 | 11 | 2 | 5 | 223 | 618 | 996 | 1,292 |
| 2019 | 846 | 557 | 243 | 257 | 9 | 4 | 17 | 18 | 289 | 790 | 988 | 972 |
| 2020 | 1,040 | 918 | 237 | 49 | 1 | 2 | 7 | 6 | 245 | 661 | 850 | 587 |
| 2021 | 833 | 508 | 178 | 243 | 71 | 28 | 2 | 1 | 202 | 580 | 761 | 894 |
| 2022 | 870 | 594 | 200 | 156 | 1 | 9 | 1 | 34 | 166 | 548 | 753 | 992 |
| 2023 | 821 | 655 | 152 | 67 | 8 | 18 | 4 | 1 | 185 | 635 | 792 | 916 |
| 2024 | 786 | 547 | 157 | 70 | 2 | 12 | 6 | 10 | 149 | 584 | 735 | 735 |
| 2025 | 760 | 412 | 94 | 111 | ||||||||
| - = No Data Reported; -- = Not Applicable; NA = Not Available; W = Withheld to avoid disclosure of individual company data. |
| Release Date: 6/30/2025 |
| Next Release Date: 7/31/2025 |