|
Download Data (XLS File) |
|
||||||||
|
||||||||
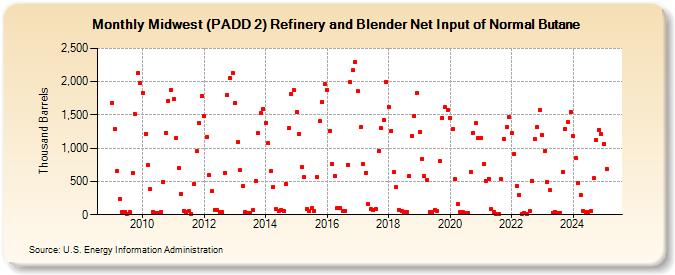
| Midwest (PADD 2) Refinery and Blender Net Input of Normal Butane (Thousand Barrels) | ||||||||
| Year | Jan | Feb | Mar | Apr | May | Jun | Jul | Aug | Sep | Oct | Nov | Dec |
|---|---|---|---|---|---|---|---|---|---|---|---|---|
| 2009 | 1,681 | 1,288 | 664 | 231 | 46 | 40 | 18 | 35 | 625 | 1,508 | 2,124 | 1,976 |
| 2010 | 1,830 | 1,219 | 742 | 379 | 48 | 25 | 28 | 41 | 499 | 1,234 | 1,716 | 1,876 |
| 2011 | 1,736 | 1,157 | 701 | 316 | 61 | 36 | 50 | 15 | 464 | 951 | 1,376 | 1,787 |
| 2012 | 1,485 | 1,171 | 595 | 349 | 75 | 69 | 43 | 44 | 629 | 1,805 | 2,054 | 2,130 |
| 2013 | 1,682 | 1,100 | 671 | 433 | 39 | 27 | 24 | 69 | 514 | 1,223 | 1,523 | 1,593 |
| 2014 | 1,380 | 1,072 | 653 | 420 | 85 | 49 | 69 | 55 | 466 | 1,301 | 1,816 | 1,871 |
| 2015 | 1,544 | 1,215 | 714 | 562 | 86 | 62 | 97 | 57 | 566 | 1,402 | 1,696 | 1,958 |
| 2016 | 1,877 | 1,262 | 763 | 579 | 102 | 107 | 56 | 58 | 751 | 1,992 | 2,171 | 2,296 |
| 2017 | 1,853 | 1,311 | 763 | 631 | 157 | 80 | 72 | 88 | 954 | 1,297 | 1,427 | 1,999 |
| 2018 | 1,617 | 1,262 | 641 | 412 | 76 | 54 | 34 | 41 | 585 | 1,188 | 1,488 | 1,829 |
| 2019 | 1,241 | 838 | 576 | 518 | 35 | 43 | 71 | 51 | 800 | 1,457 | 1,618 | 1,574 |
| 2020 | 1,460 | 1,285 | 535 | 163 | 48 | 39 | 27 | 26 | 644 | 1,229 | 1,374 | 1,151 |
| 2021 | 1,155 | 767 | 513 | 541 | 85 | 42 | 18 | 15 | 531 | 1,139 | 1,317 | 1,465 |
| 2022 | 1,230 | 920 | 435 | 303 | 18 | 25 | 15 | 57 | 508 | 1,142 | 1,311 | 1,581 |
| 2023 | 1,195 | 961 | 493 | 365 | 33 | 43 | 30 | 31 | 647 | 1,289 | 1,388 | 1,549 |
| 2024 | 1,182 | |||||||||||
| - = No Data Reported; -- = Not Applicable; NA = Not Available; W = Withheld to avoid disclosure of individual company data. |
| Release Date: 3/29/2024 |
| Next Release Date: 4/30/2024 |