|
Download Data (XLS File) |
|
||||||||
|
||||||||
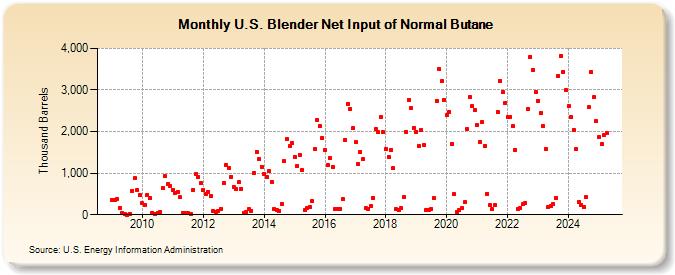
| U.S. Blender Net Input of Normal Butane (Thousand Barrels) | ||||||||
| Year | Jan | Feb | Mar | Apr | May | Jun | Jul | Aug | Sep | Oct | Nov | Dec |
|---|---|---|---|---|---|---|---|---|---|---|---|---|
| 2009 | 353 | 363 | 377 | 168 | 48 | 27 | 1 | 25 | 581 | 871 | 589 | 475 |
| 2010 | 272 | 231 | 482 | 397 | 48 | 16 | 36 | 69 | 642 | 922 | 741 | 693 |
| 2011 | 599 | 530 | 556 | 418 | 51 | 37 | 30 | 25 | 602 | 970 | 911 | 755 |
| 2012 | 599 | 497 | 555 | 455 | 88 | 67 | 88 | 141 | 762 | 1,201 | 1,127 | 919 |
| 2013 | 676 | 622 | 777 | 630 | 51 | 63 | 129 | 96 | 1,004 | 1,519 | 1,342 | 1,154 |
| 2014 | 986 | 895 | 1,049 | 792 | 137 | 107 | 101 | 267 | 1,297 | 1,817 | 1,646 | 1,729 |
| 2015 | 1,397 | 1,173 | 1,446 | 1,086 | 111 | 156 | 186 | 322 | 1,576 | 2,289 | 2,130 | 1,850 |
| 2016 | 1,557 | 1,191 | 1,361 | 1,148 | 146 | 139 | 145 | 369 | 1,805 | 2,671 | 2,537 | 2,077 |
| 2017 | 1,739 | 1,218 | 1,512 | 1,333 | 161 | 144 | 208 | 411 | 2,063 | 1,980 | 2,342 | 1,978 |
| 2018 | 1,578 | 1,387 | 1,565 | 1,112 | 129 | 111 | 152 | 431 | 2,000 | 2,760 | 2,555 | 2,095 |
| 2019 | 1,999 | 1,663 | 2,043 | 1,686 | 118 | 123 | 138 | 400 | 2,741 | 3,494 | 3,208 | 2,765 |
| 2020 | 2,389 | 2,474 | 1,710 | 487 | 68 | 103 | 158 | 296 | 2,052 | 2,833 | 2,612 | 2,507 |
| 2021 | 2,155 | 1,759 | 2,225 | 1,663 | 507 | 227 | 130 | 223 | 2,475 | 3,226 | 2,957 | 2,694 |
| 2022 | 2,347 | 2,350 | 2,125 | 1,555 | 143 | 167 | 247 | 279 | 2,551 | 3,804 | 3,481 | 2,946 |
| 2023 | 2,745 | 2,450 | 2,133 | 1,578 | 181 | 200 | 258 | 413 | 3,339 | 3,825 | 3,443 | 2,995 |
| 2024 | 2,610 | 2,349 | 2,044 | 1,588 | 308 | 236 | 188 | 414 | 2,584 | 3,432 | 2,821 | 2,244 |
| 2025 | 1,869 | 1,699 | 1,929 | 1,955 | ||||||||
| - = No Data Reported; -- = Not Applicable; NA = Not Available; W = Withheld to avoid disclosure of individual company data. |
| Release Date: 6/30/2025 |
| Next Release Date: 7/31/2025 |
Referring Pages: