|
Download Data (XLS File) |
|
||||||||
|
||||||||
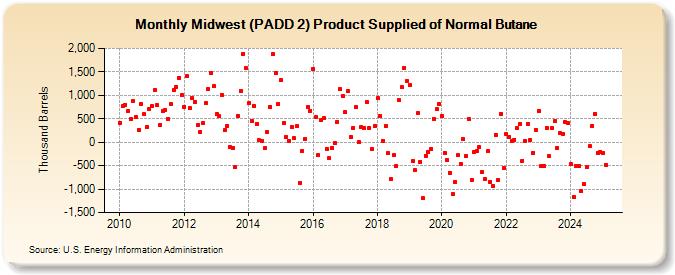
| Midwest (PADD 2) Product Supplied of Normal Butane (Thousand Barrels) | ||||||||
| Year | Jan | Feb | Mar | Apr | May | Jun | Jul | Aug | Sep | Oct | Nov | Dec |
|---|---|---|---|---|---|---|---|---|---|---|---|---|
| 2010 | 418 | 767 | 800 | 666 | 489 | 873 | 528 | 257 | 819 | 591 | 319 | 716 |
| 2011 | 763 | 1,104 | 786 | 363 | 662 | 691 | 501 | 814 | 1,111 | 1,180 | 1,375 | 1,007 |
| 2012 | 757 | 1,407 | 722 | 941 | 863 | 363 | 215 | 411 | 830 | 1,134 | 1,474 | 1,189 |
| 2013 | 594 | 555 | 1,010 | 260 | 352 | -92 | -130 | -530 | 561 | 1,098 | 1,889 | 1,573 |
| 2014 | 831 | 459 | 775 | 391 | 43 | 30 | -133 | 214 | 752 | 1,872 | 1,481 | 822 |
| 2015 | 1,325 | 417 | 112 | 33 | 321 | 81 | 344 | -863 | -192 | 76 | 750 | 671 |
| 2016 | 1,557 | 532 | -278 | 471 | 507 | -141 | -344 | -113 | -21 | 431 | 1,139 | 982 |
| 2017 | 643 | 1,081 | 116 | 309 | 749 | 1 | 327 | 299 | 857 | 303 | -143 | 350 |
| 2018 | 940 | 560 | 34 | 349 | -233 | -790 | -278 | -511 | 892 | 1,167 | 1,591 | 1,310 |
| 2019 | 1,217 | -411 | -602 | 614 | -416 | -1,199 | -287 | -214 | -142 | 500 | 702 | 815 |
| 2020 | 567 | -227 | -379 | -647 | -1,114 | -839 | -283 | -458 | 63 | -299 | 500 | -798 |
| 2021 | -205 | -182 | -108 | -636 | -780 | -197 | -838 | -925 | 157 | -808 | 609 | -554 |
| 2022 | 172 | 106 | 21 | 57 | 302 | 385 | -394 | 28 | 395 | 47 | -223 | 269 |
| 2023 | 429 | -678 | -785 | -393 | -415 | 490 | 348 | -98 | 20 | -1 | 362 | 264 |
| 2024 | -465 | -1,122 | -455 | -540 | ||||||||
| - = No Data Reported; -- = Not Applicable; NA = Not Available; W = Withheld to avoid disclosure of individual company data. |
| Release Date: 6/28/2024 |
| Next Release Date: 7/31/2024 |