|
Download Data (XLS File) |
|
||||||||
|
||||||||
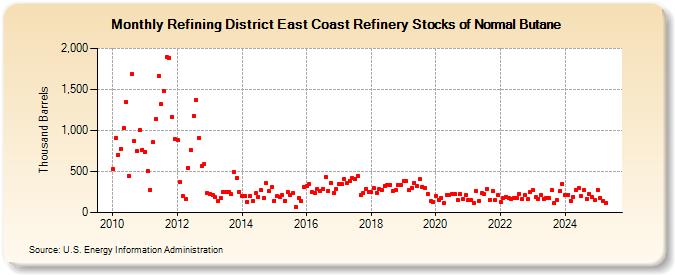
| Refining District East Coast Refinery Stocks of Normal Butane (Thousand Barrels) | ||||||||
| Year | Jan | Feb | Mar | Apr | May | Jun | Jul | Aug | Sep | Oct | Nov | Dec |
|---|---|---|---|---|---|---|---|---|---|---|---|---|
| 2010 | 525 | 907 | 707 | 778 | 1,025 | 1,347 | 451 | 1,693 | 866 | 748 | 1,006 | 763 |
| 2011 | 743 | 506 | 279 | 854 | 1,142 | 1,667 | 1,317 | 1,486 | 1,891 | 1,885 | 1,167 | 891 |
| 2012 | 888 | 367 | 202 | 164 | 547 | 765 | 1,179 | 1,377 | 911 | 568 | 590 | 240 |
| 2013 | 232 | 208 | 184 | 138 | 183 | 247 | 255 | 256 | 222 | 498 | 425 | 255 |
| 2014 | 204 | 201 | 129 | 196 | 144 | 234 | 187 | 274 | 180 | 363 | 257 | 310 |
| 2015 | 145 | 200 | 191 | 212 | 145 | 246 | 212 | 238 | 66 | 179 | 137 | 314 |
| 2016 | 326 | 345 | 247 | 233 | 285 | 266 | 292 | 428 | 266 | 366 | 244 | 290 |
| 2017 | 347 | 342 | 409 | 365 | 389 | 421 | 411 | 450 | 210 | 242 | 293 | 251 |
| 2018 | 250 | 294 | 242 | 283 | 278 | 329 | 337 | 339 | 262 | 274 | 332 | 332 |
| 2019 | 382 | 383 | 280 | 304 | 366 | 322 | 405 | 317 | 301 | 232 | 135 | 132 |
| 2020 | 207 | 154 | 181 | 111 | 219 | 220 | 226 | 232 | 152 | 229 | 162 | 213 |
| 2021 | 148 | 153 | 120 | 260 | 146 | 235 | 226 | 288 | 158 | 262 | 150 | 218 |
| 2022 | 123 | 175 | 195 | 183 | 167 | 177 | 182 | 228 | 164 | 214 | 160 | 252 |
| 2023 | 272 | 188 | 171 | 208 | 166 | 175 | 177 | 272 | 112 | 152 | 258 | 350 |
| 2024 | 220 | 217 | 144 | 192 | 275 | 305 | 199 | 271 | 170 | 228 | 189 | 154 |
| 2025 | 279 | 182 | 138 | 121 | ||||||||
| - = No Data Reported; -- = Not Applicable; NA = Not Available; W = Withheld to avoid disclosure of individual company data. |
| Release Date: 6/30/2025 |
| Next Release Date: 7/31/2025 |
Referring Pages: