|
Download Data (XLS File) |
|
||||||||
|
||||||||
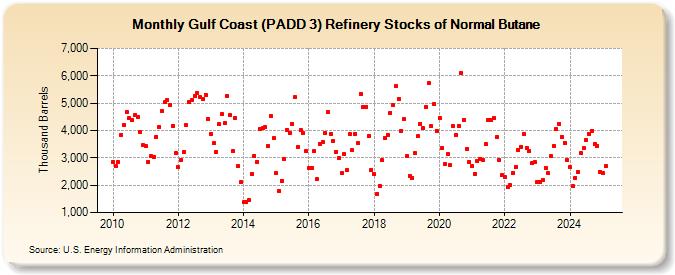
| Gulf Coast (PADD 3) Refinery Stocks of Normal Butane (Thousand Barrels) | ||||||||
| Year | Jan | Feb | Mar | Apr | May | Jun | Jul | Aug | Sep | Oct | Nov | Dec |
|---|---|---|---|---|---|---|---|---|---|---|---|---|
| 2010 | 2,858 | 2,698 | 2,846 | 3,848 | 4,207 | 4,670 | 4,441 | 4,388 | 4,553 | 4,502 | 3,961 | 3,458 |
| 2011 | 3,422 | 2,863 | 3,069 | 3,036 | 3,776 | 4,134 | 4,716 | 5,031 | 5,129 | 4,916 | 4,171 | 3,169 |
| 2012 | 2,672 | 2,921 | 3,228 | 4,185 | 5,049 | 5,108 | 5,270 | 5,372 | 5,209 | 5,167 | 5,306 | 4,415 |
| 2013 | 3,868 | 3,528 | 3,214 | 4,229 | 4,604 | 4,260 | 5,267 | 4,561 | 3,245 | 4,451 | 2,698 | 2,107 |
| 2014 | 1,369 | 1,382 | 1,454 | 2,420 | 3,077 | 2,860 | 4,050 | 4,081 | 4,125 | 3,447 | 4,517 | 3,721 |
| 2015 | 2,435 | 1,797 | 2,168 | 2,950 | 4,030 | 3,890 | 4,246 | 5,206 | 3,407 | 4,009 | 3,910 | 3,232 |
| 2016 | 2,623 | 2,645 | 3,237 | 2,216 | 3,514 | 3,562 | 3,899 | 4,665 | 3,881 | 3,616 | 3,229 | 2,990 |
| 2017 | 2,431 | 3,136 | 2,538 | 3,857 | 3,269 | 3,885 | 3,535 | 5,340 | 4,873 | 4,871 | 3,799 | 2,568 |
| 2018 | 2,408 | 1,672 | 1,973 | 2,905 | 3,740 | 3,852 | 4,648 | 4,926 | 5,609 | 5,161 | 3,993 | 4,406 |
| 2019 | 3,051 | 2,353 | 2,271 | 3,162 | 3,784 | 4,244 | 4,085 | 4,859 | 5,741 | 4,151 | 4,981 | 3,990 |
| 2020 | 4,463 | 3,377 | 2,760 | 3,146 | 2,721 | 4,149 | 3,830 | 4,177 | 6,085 | 4,396 | 3,337 | 2,859 |
| 2021 | 2,706 | 2,425 | 2,886 | 2,970 | 2,919 | 3,492 | 4,393 | 4,395 | 4,460 | 3,756 | 2,918 | 2,371 |
| 2022 | 2,293 | 1,922 | 2,007 | 2,439 | 2,657 | 3,286 | 3,403 | 3,864 | 3,366 | 3,243 | 2,794 | 2,840 |
| 2023 | 2,130 | 2,102 | 2,196 | 2,638 | 2,433 | 3,056 | 3,435 | 4,050 | 4,254 | 3,774 | 3,552 | 2,929 |
| 2024 | 2,660 | |||||||||||
| - = No Data Reported; -- = Not Applicable; NA = Not Available; W = Withheld to avoid disclosure of individual company data. |
| Release Date: 3/29/2024 |
| Next Release Date: 4/30/2024 |