|
Download Data (XLS File) |
|
||||||||
|
||||||||
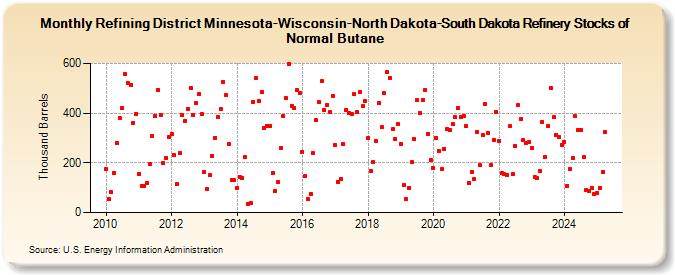
| Refining District Minnesota-Wisconsin-North Dakota-South Dakota Refinery Stocks of Normal Butane (Thousand Barrels) | ||||||||
| Year | Jan | Feb | Mar | Apr | May | Jun | Jul | Aug | Sep | Oct | Nov | Dec |
|---|---|---|---|---|---|---|---|---|---|---|---|---|
| 2010 | 175 | 56 | 82 | 161 | 279 | 381 | 420 | 556 | 520 | 514 | 362 | 396 |
| 2011 | 156 | 108 | 105 | 119 | 197 | 309 | 390 | 495 | 394 | 199 | 220 | 305 |
| 2012 | 316 | 231 | 115 | 239 | 391 | 369 | 418 | 503 | 394 | 441 | 477 | 396 |
| 2013 | 163 | 93 | 150 | 227 | 301 | 386 | 416 | 526 | 472 | 275 | 132 | 130 |
| 2014 | 99 | 145 | 140 | 223 | 35 | 40 | 444 | 543 | 448 | 486 | 339 | 350 |
| 2015 | 347 | 161 | 88 | 122 | 258 | 388 | 462 | 598 | 429 | 420 | 493 | 481 |
| 2016 | 244 | 146 | 53 | 76 | 238 | 371 | 446 | 528 | 414 | 433 | 403 | 471 |
| 2017 | 273 | 125 | 136 | 276 | 412 | 402 | 395 | 477 | 403 | 485 | 427 | 448 |
| 2018 | 301 | 169 | 202 | 286 | 441 | 343 | 481 | 567 | 543 | 335 | 295 | 358 |
| 2019 | 276 | 111 | 54 | 97 | 202 | 296 | 452 | 400 | 455 | 495 | 317 | 212 |
| 2020 | 179 | 302 | 249 | 174 | 257 | 337 | 333 | 356 | 384 | 420 | 384 | 390 |
| 2021 | 349 | 118 | 165 | 135 | 326 | 190 | 313 | 436 | 322 | 190 | 294 | 406 |
| 2022 | 289 | 158 | 154 | 150 | 347 | 155 | 266 | 431 | 378 | 293 | 280 | 284 |
| 2023 | 261 | 143 | 136 | 152 | 351 | 190 | 347 | 503 | 383 | 314 | 306 | 272 |
| 2024 | 283 | |||||||||||
| - = No Data Reported; -- = Not Applicable; NA = Not Available; W = Withheld to avoid disclosure of individual company data. |
| Release Date: 3/29/2024 |
| Next Release Date: 4/30/2024 |