|
Download Data (XLS File) |
|
||||||||
|
||||||||
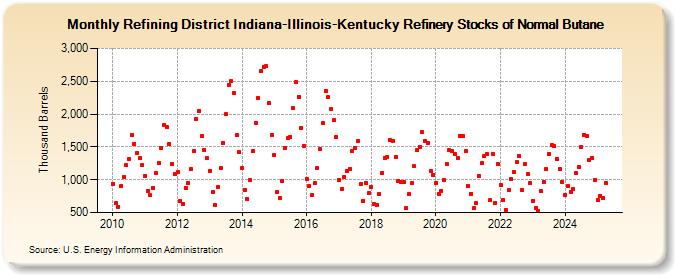
| Refining District Indiana-Illinois-Kentucky Refinery Stocks of Normal Butane (Thousand Barrels) | ||||||||
| Year | Jan | Feb | Mar | Apr | May | Jun | Jul | Aug | Sep | Oct | Nov | Dec |
|---|---|---|---|---|---|---|---|---|---|---|---|---|
| 2010 | 939 | 641 | 590 | 903 | 1,040 | 1,218 | 1,314 | 1,679 | 1,551 | 1,410 | 1,333 | 1,220 |
| 2011 | 1,062 | 832 | 763 | 872 | 1,095 | 1,260 | 1,485 | 1,829 | 1,798 | 1,545 | 1,247 | 1,089 |
| 2012 | 1,114 | 676 | 631 | 871 | 943 | 1,157 | 1,435 | 1,924 | 2,052 | 1,673 | 1,457 | 1,328 |
| 2013 | 1,134 | 810 | 611 | 891 | 1,172 | 1,563 | 1,995 | 2,447 | 2,502 | 2,321 | 1,675 | 1,417 |
| 2014 | 1,184 | 846 | 705 | 999 | 1,430 | 1,867 | 2,252 | 2,655 | 2,721 | 2,728 | 2,165 | 1,679 |
| 2015 | 1,375 | 818 | 723 | 978 | 1,487 | 1,633 | 1,653 | 2,085 | 2,485 | 2,267 | 1,795 | 1,521 |
| 2016 | 1,011 | 898 | 767 | 943 | 1,178 | 1,472 | 1,862 | 2,353 | 2,259 | 2,073 | 1,907 | 1,651 |
| 2017 | 991 | 855 | 1,038 | 1,136 | 1,161 | 1,443 | 1,488 | 1,592 | 929 | 680 | 955 | 796 |
| 2018 | 895 | 628 | 616 | 784 | 1,101 | 1,334 | 1,343 | 1,608 | 1,588 | 1,352 | 984 | 960 |
| 2019 | 964 | 575 | 778 | 947 | 1,202 | 1,452 | 1,504 | 1,722 | 1,583 | 1,556 | 1,133 | 1,079 |
| 2020 | 944 | 787 | 833 | 990 | 1,232 | 1,446 | 1,432 | 1,387 | 1,328 | 1,668 | 1,665 | 1,436 |
| 2021 | 910 | 788 | 562 | 644 | 1,053 | 1,248 | 1,356 | 1,386 | 684 | 1,395 | 652 | 1,237 |
| 2022 | 920 | 690 | 544 | 839 | 1,006 | 1,116 | 1,263 | 1,354 | 843 | 1,234 | 1,082 | 945 |
| 2023 | 687 | 568 | 521 | 821 | 969 | 1,165 | 1,396 | 1,532 | 1,512 | 1,317 | 1,161 | 963 |
| 2024 | 771 | |||||||||||
| - = No Data Reported; -- = Not Applicable; NA = Not Available; W = Withheld to avoid disclosure of individual company data. |
| Release Date: 3/29/2024 |
| Next Release Date: 4/30/2024 |