|
Download Data (XLS File) |
|
||||||||
|
||||||||
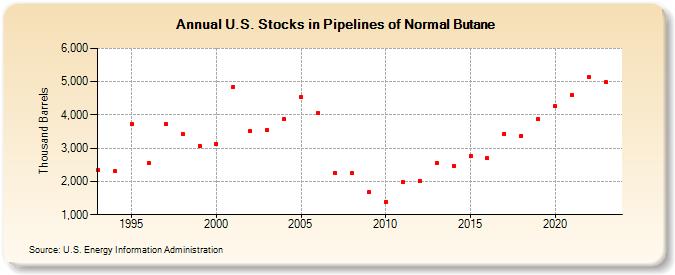
| U.S. Stocks in Pipelines of Normal Butane (Thousand Barrels) | ||||||||
| Decade | Year-0 | Year-1 | Year-2 | Year-3 | Year-4 | Year-5 | Year-6 | Year-7 | Year-8 | Year-9 |
|---|---|---|---|---|---|---|---|---|---|---|
| 1990's | 2,338 | 2,304 | 3,725 | 2,565 | 3,724 | 3,424 | 3,072 | |||
| 2000's | 3,133 | 4,851 | 3,514 | 3,544 | 3,871 | 4,536 | 4,064 | 2,257 | 2,254 | 1,675 |
| 2010's | 1,396 | 1,982 | 2,024 | 2,564 | 2,474 | 2,764 | 2,702 | 3,440 | 3,377 | 3,867 |
| 2020's | 4,268 | 4,592 | 5,126 | 4,976 |
| - = No Data Reported; -- = Not Applicable; NA = Not Available; W = Withheld to avoid disclosure of individual company data. |
| Release Date: 3/29/2024 |
| Next Release Date: 8/30/2024 |