|
Download Data (XLS File) |
|
||||||||
|
||||||||
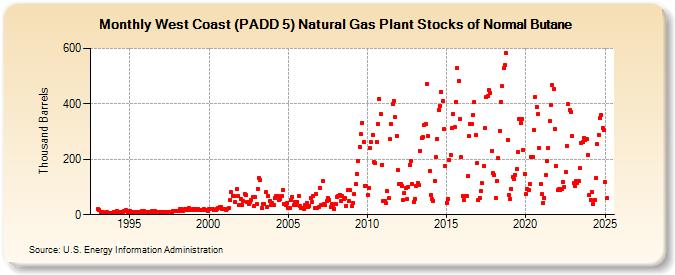
| West Coast (PADD 5) Natural Gas Plant Stocks of Normal Butane (Thousand Barrels) | ||||||||
| Year | Jan | Feb | Mar | Apr | May | Jun | Jul | Aug | Sep | Oct | Nov | Dec |
|---|---|---|---|---|---|---|---|---|---|---|---|---|
| 1993 | 21 | 17 | 11 | 8 | 8 | 7 | 7 | 8 | 5 | 6 | 6 | 7 |
| 1994 | 11 | 10 | 12 | 11 | 10 | 9 | 11 | 11 | 13 | 16 | 12 | 10 |
| 1995 | 14 | 11 | 10 | 9 | 8 | 8 | 8 | 10 | 9 | 12 | 10 | 13 |
| 1996 | 9 | 9 | 9 | 9 | 11 | 12 | 8 | 12 | 9 | 10 | 9 | 8 |
| 1997 | 8 | 7 | 11 | 9 | 8 | 10 | 6 | 8 | 9 | 13 | 13 | 15 |
| 1998 | 14 | 15 | 20 | 21 | 15 | 17 | 20 | 20 | 16 | 23 | 16 | 16 |
| 1999 | 20 | 20 | 18 | 16 | 20 | 18 | 18 | 18 | 21 | 18 | 16 | 15 |
| 2000 | 19 | 19 | 21 | 19 | 17 | 16 | 20 | 25 | 27 | 28 | 22 | 21 |
| 2001 | 20 | 16 | 20 | 24 | 52 | 81 | 68 | 67 | 45 | 92 | 67 | 35 |
| 2002 | 56 | 36 | 49 | 74 | 71 | 45 | 40 | 45 | 54 | 63 | 32 | 63 |
| 2003 | 37 | 93 | 131 | 125 | 24 | 39 | 39 | 81 | 27 | 67 | 51 | 35 |
| 2004 | 44 | 35 | 61 | 68 | 68 | 54 | 55 | 68 | 89 | 38 | 34 | 41 |
| 2005 | 24 | 26 | 52 | 65 | 36 | 46 | 35 | 47 | 69 | 32 | 23 | 24 |
| 2006 | 22 | 36 | 44 | 28 | 33 | 62 | 45 | 69 | 25 | 74 | 26 | 27 |
| 2007 | 97 | 34 | 122 | 38 | 34 | 50 | 61 | 54 | 28 | 38 | 31 | 22 |
| 2008 | 40 | 64 | 67 | 72 | 50 | 67 | 55 | 59 | 33 | 90 | 48 | 88 |
| 2009 | 30 | 44 | 73 | 109 | 146 | 194 | 246 | 290 | 332 | 261 | 104 | 102 |
| 2010 | 70 | 97 | 239 | 262 | 289 | 189 | 188 | 264 | 327 | 419 | 363 | 181 |
| 2011 | 51 | 50 | 41 | 84 | 59 | 272 | 327 | 399 | 412 | 351 | 285 | 161 |
| 2012 | 109 | 109 | 102 | 54 | 77 | 96 | 57 | 99 | 181 | 193 | 111 | 45 |
| 2013 | 56 | 104 | 113 | 106 | 231 | 276 | 280 | 325 | 328 | 472 | 283 | 158 |
| 2014 | 71 | 56 | 50 | 121 | 207 | 274 | 379 | 393 | 444 | 409 | 308 | 176 |
| 2015 | 44 | 57 | 197 | 217 | 314 | 365 | 315 | 407 | 529 | 482 | 346 | 207 |
| 2016 | 67 | 52 | 67 | 66 | 139 | 283 | 326 | 327 | 361 | 408 | 288 | 186 |
| 2017 | 52 | 62 | 85 | 113 | 175 | 312 | 423 | 428 | 449 | 440 | 231 | 149 |
| 2018 | 142 | 62 | 121 | 204 | 303 | 406 | 463 | 528 | 540 | 583 | 271 | 72 |
| 2019 | 55 | 93 | 137 | 130 | 145 | 164 | 227 | 344 | 331 | 344 | 234 | 147 |
| 2020 | 74 | 93 | 90 | 112 | 210 | 208 | 307 | 426 | 389 | 363 | 241 | 110 |
| 2021 | 73 | 44 | 62 | 142 | 193 | 242 | 338 | 395 | 467 | 452 | 308 | 175 |
| 2022 | 89 | 91 | 90 | 92 | 118 | 100 | 154 | 248 | 398 | 379 | 371 | 285 |
| 2023 | 113 | 103 | 123 | 115 | 120 | 168 | 260 | 261 | 276 | 268 | 272 | 217 |
| 2024 | 70 | |||||||||||
| - = No Data Reported; -- = Not Applicable; NA = Not Available; W = Withheld to avoid disclosure of individual company data. |
| Release Date: 3/29/2024 |
| Next Release Date: 4/30/2024 |