|
Download Data (XLS File) |
|
||||||||
|
||||||||
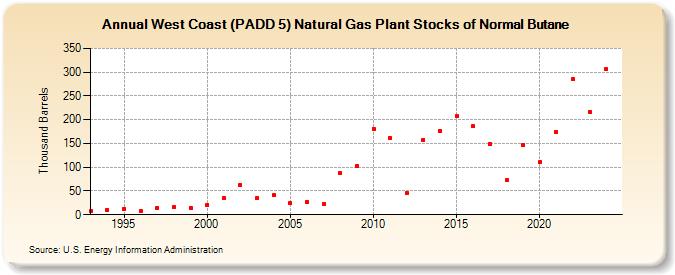
| West Coast (PADD 5) Natural Gas Plant Stocks of Normal Butane (Thousand Barrels) | ||||||||
| Decade | Year-0 | Year-1 | Year-2 | Year-3 | Year-4 | Year-5 | Year-6 | Year-7 | Year-8 | Year-9 |
|---|---|---|---|---|---|---|---|---|---|---|
| 1990's | 7 | 10 | 13 | 8 | 15 | 16 | 15 | |||
| 2000's | 21 | 35 | 63 | 35 | 41 | 24 | 27 | 22 | 88 | 102 |
| 2010's | 181 | 161 | 45 | 158 | 176 | 207 | 186 | 149 | 72 | 147 |
| 2020's | 110 | 175 | 285 | 217 |
| - = No Data Reported; -- = Not Applicable; NA = Not Available; W = Withheld to avoid disclosure of individual company data. |
| Release Date: 6/28/2024 |
| Next Release Date: 8/30/2024 |