|
Download Data (XLS File) |
|
||||||||
|
||||||||
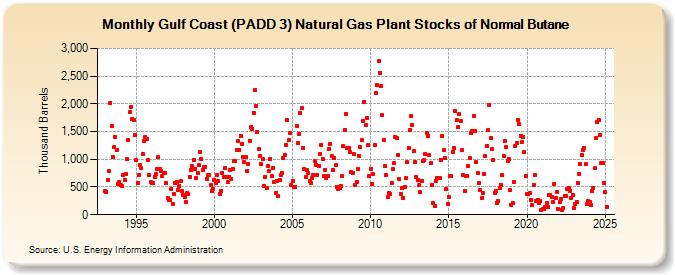
| Gulf Coast (PADD 3) Natural Gas Plant Stocks of Normal Butane (Thousand Barrels) | ||||||||
| Year | Jan | Feb | Mar | Apr | May | Jun | Jul | Aug | Sep | Oct | Nov | Dec |
|---|---|---|---|---|---|---|---|---|---|---|---|---|
| 1993 | 425 | 405 | 628 | 782 | 2,011 | 1,609 | 1,043 | 1,216 | 1,395 | 1,165 | 560 | 590 |
| 1994 | 532 | 516 | 718 | 635 | 734 | 996 | 1,355 | 1,844 | 1,950 | 1,732 | 1,705 | 1,439 |
| 1995 | 980 | 573 | 719 | 892 | 834 | 1,094 | 1,324 | 1,397 | 1,373 | 989 | 719 | 583 |
| 1996 | 571 | 575 | 687 | 734 | 833 | 1,034 | 819 | 793 | 706 | 748 | 760 | 565 |
| 1997 | 306 | 264 | 264 | 465 | 198 | 373 | 571 | 591 | 443 | 520 | 603 | 423 |
| 1998 | 361 | 320 | 225 | 383 | 378 | 689 | 807 | 870 | 987 | 829 | 658 | 756 |
| 1999 | 893 | 1,124 | 1,007 | 810 | 853 | 861 | 652 | 708 | 719 | 527 | 430 | 464 |
| 2000 | 629 | 572 | 713 | 603 | 374 | 432 | 760 | 676 | 851 | 674 | 585 | 686 |
| 2001 | 798 | 637 | 829 | 961 | 971 | 1,165 | 1,333 | 1,176 | 1,422 | 1,279 | 1,035 | 953 |
| 2002 | 1,035 | 796 | 910 | 1,338 | 1,582 | 1,548 | 1,842 | 2,256 | 1,967 | 1,491 | 1,177 | 1,051 |
| 2003 | 921 | 1,008 | 514 | 689 | 481 | 880 | 787 | 1,003 | 694 | 851 | 594 | 396 |
| 2004 | 602 | 343 | 626 | 721 | 747 | 1,016 | 1,085 | 1,266 | 1,708 | 1,341 | 1,474 | 536 |
| 2005 | 607 | 494 | 502 | 1,604 | 1,298 | 1,450 | 1,838 | 1,925 | 1,208 | 818 | 682 | 801 |
| 2006 | 748 | 605 | 576 | 671 | 722 | 964 | 904 | 712 | 876 | 1,100 | 1,258 | 1,010 |
| 2007 | 707 | 815 | 663 | 699 | 1,185 | 1,273 | 1,052 | 811 | 1,022 | 892 | 506 | 467 |
| 2008 | 473 | 511 | 702 | 1,243 | 1,534 | 1,822 | 1,200 | 1,201 | 1,126 | 765 | 755 | 1,103 |
| 2009 | 530 | 590 | 829 | 1,066 | 1,229 | 1,342 | 1,692 | 2,035 | 1,610 | 1,745 | 1,249 | 704 |
| 2010 | 833 | 562 | 731 | 1,252 | 2,191 | 2,338 | 2,771 | 2,564 | 2,317 | 1,795 | 1,354 | 883 |
| 2011 | 719 | 314 | 395 | 380 | 570 | 819 | 925 | 1,395 | 1,377 | 1,085 | 639 | 376 |
| 2012 | 487 | 298 | 496 | 662 | 942 | 1,198 | 1,524 | 1,772 | 1,617 | 1,141 | 951 | 682 |
| 2013 | 623 | 543 | 401 | 613 | 963 | 982 | 1,095 | 1,478 | 1,420 | 1,075 | 928 | 544 |
| 2014 | 214 | 160 | 610 | 658 | 654 | 656 | 989 | 1,417 | 1,159 | 1,019 | 468 | 190 |
| 2015 | 320 | 706 | 691 | 1,132 | 1,204 | 1,869 | 1,708 | 1,574 | 1,821 | 1,684 | 1,163 | 711 |
| 2016 | 429 | 699 | 691 | 878 | 1,028 | 1,468 | 1,506 | 1,789 | 1,503 | 944 | 745 | 577 |
| 2017 | 443 | 295 | 397 | 733 | 1,060 | 1,242 | 1,522 | 1,970 | 1,392 | 1,186 | 978 | 400 |
| 2018 | 421 | 215 | 243 | 477 | 534 | 715 | 1,065 | 1,325 | 1,222 | 971 | 1,008 | 438 |
| 2019 | 177 | 213 | 593 | 1,234 | 1,288 | 1,710 | 1,628 | 1,425 | 1,306 | 1,402 | 1,126 | 697 |
| 2020 | 366 | 370 | 383 | 268 | 168 | 541 | 713 | 254 | 274 | 216 | 243 | 85 |
| 2021 | 112 | 111 | 135 | 205 | 145 | 355 | 362 | 328 | 222 | 562 | 299 | 404 |
| 2022 | 107 | 229 | 279 | 89 | 130 | 344 | 338 | 455 | 484 | 436 | 295 | 360 |
| 2023 | 126 | 217 | 240 | 577 | 733 | 919 | 1,075 | 1,164 | 1,198 | 906 | 185 | 246 |
| 2024 | 238 | |||||||||||
| - = No Data Reported; -- = Not Applicable; NA = Not Available; W = Withheld to avoid disclosure of individual company data. |
| Release Date: 3/29/2024 |
| Next Release Date: 4/30/2024 |