|
Download Data (XLS File) |
|
||||||||
|
||||||||
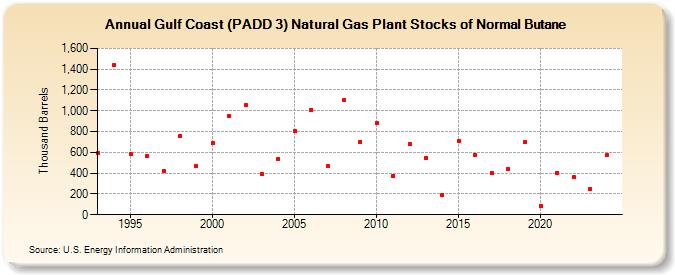
| Gulf Coast (PADD 3) Natural Gas Plant Stocks of Normal Butane (Thousand Barrels) | ||||||||
| Decade | Year-0 | Year-1 | Year-2 | Year-3 | Year-4 | Year-5 | Year-6 | Year-7 | Year-8 | Year-9 |
|---|---|---|---|---|---|---|---|---|---|---|
| 1990's | 590 | 1,439 | 583 | 565 | 423 | 756 | 464 | |||
| 2000's | 686 | 953 | 1,051 | 396 | 536 | 801 | 1,010 | 467 | 1,103 | 704 |
| 2010's | 883 | 376 | 682 | 544 | 190 | 711 | 577 | 400 | 438 | 697 |
| 2020's | 85 | 404 | 360 | 246 |
| - = No Data Reported; -- = Not Applicable; NA = Not Available; W = Withheld to avoid disclosure of individual company data. |
| Release Date: 3/29/2024 |
| Next Release Date: 8/30/2024 |